Agent Monitoring
Real-time visibility into agent execution with comprehensive session tracking, performance analytics, cost analysis, and resource optimization insights - all without a single line of instrumentation code.
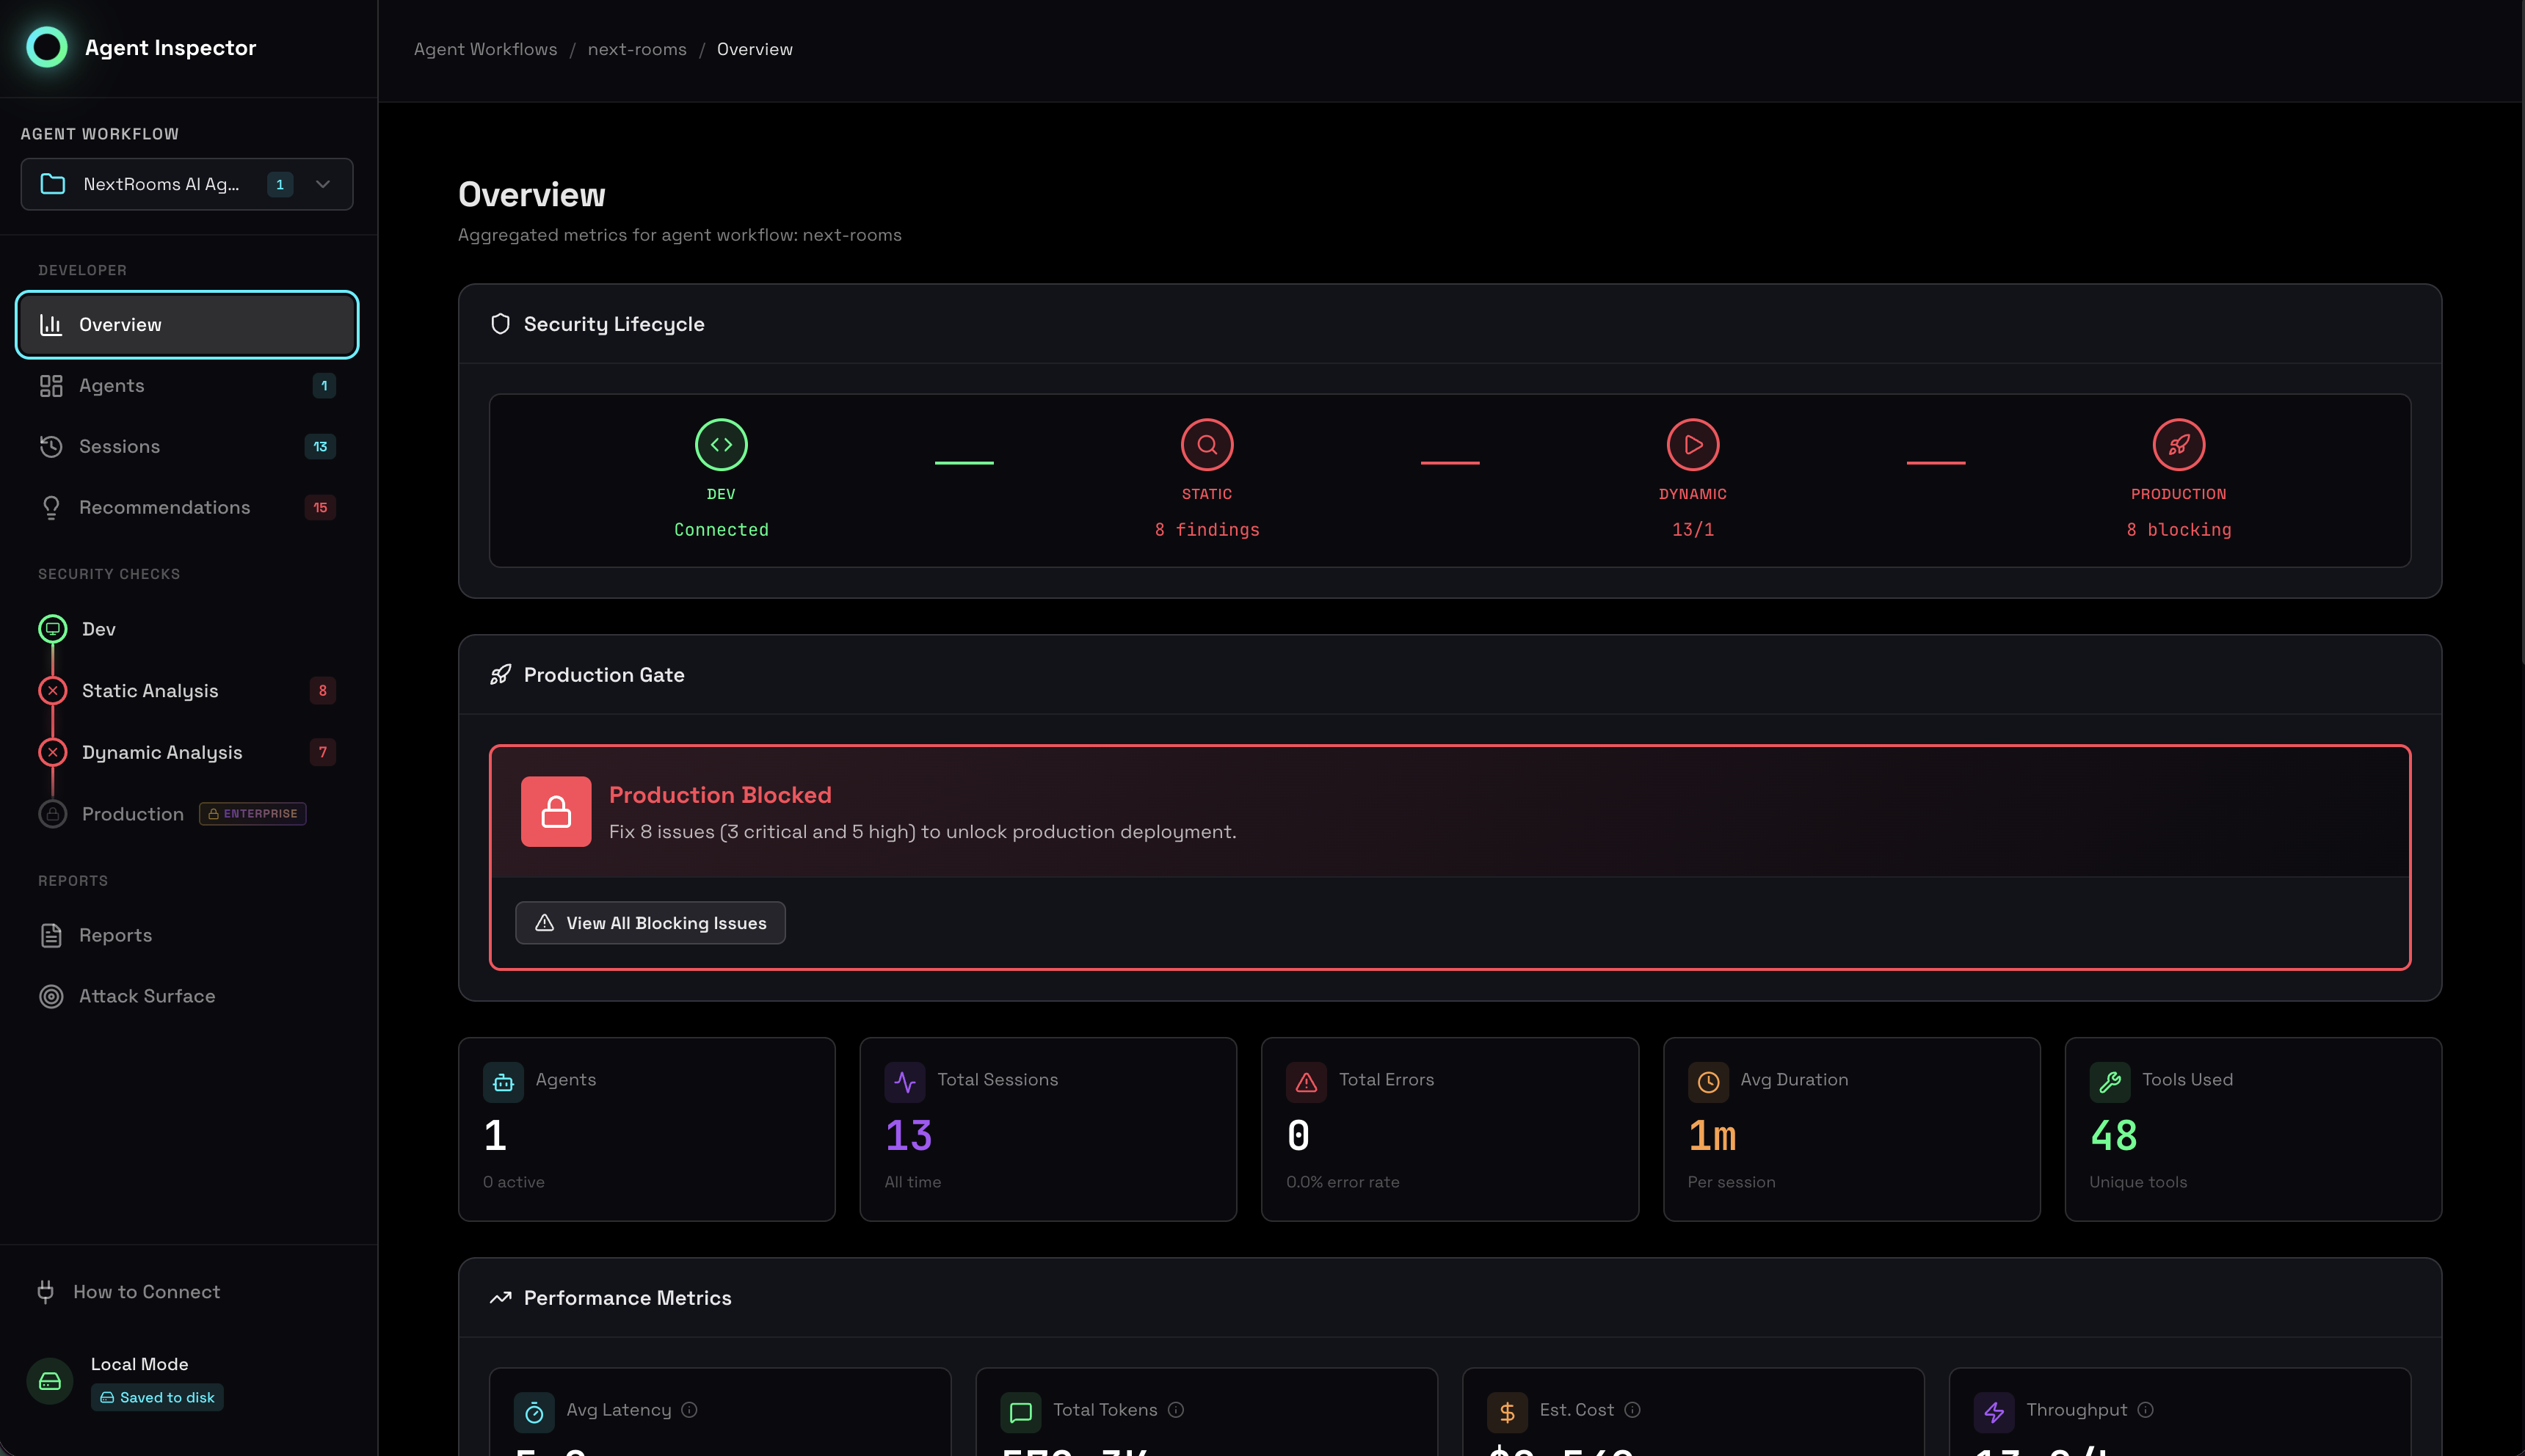
Overview
Agent Inspector provides zero-instrumentation monitoring for AI agents during development and testing. Simply route your LLM calls through the proxy, and gain instant visibility into every session, tool call, token consumed, and dollar spent. Unlike production observability platforms, Agent Inspector is purpose-built for pre-production environments where you need deep, granular insights to validate agent behavior before deployment.
The monitoring dashboard transforms raw execution data into actionable insights: identifying performance bottlenecks, detecting cost inefficiencies, tracking model usage patterns, and highlighting optimization opportunities - all in real-time as your agents run.
Session Timeline
The Sessions view provides a chronological record of every agent execution captured by Agent Inspector. Each session represents a complete agent interaction, from initial prompt to final response, with full traceability of all LLM calls, tool invocations, and state transitions.
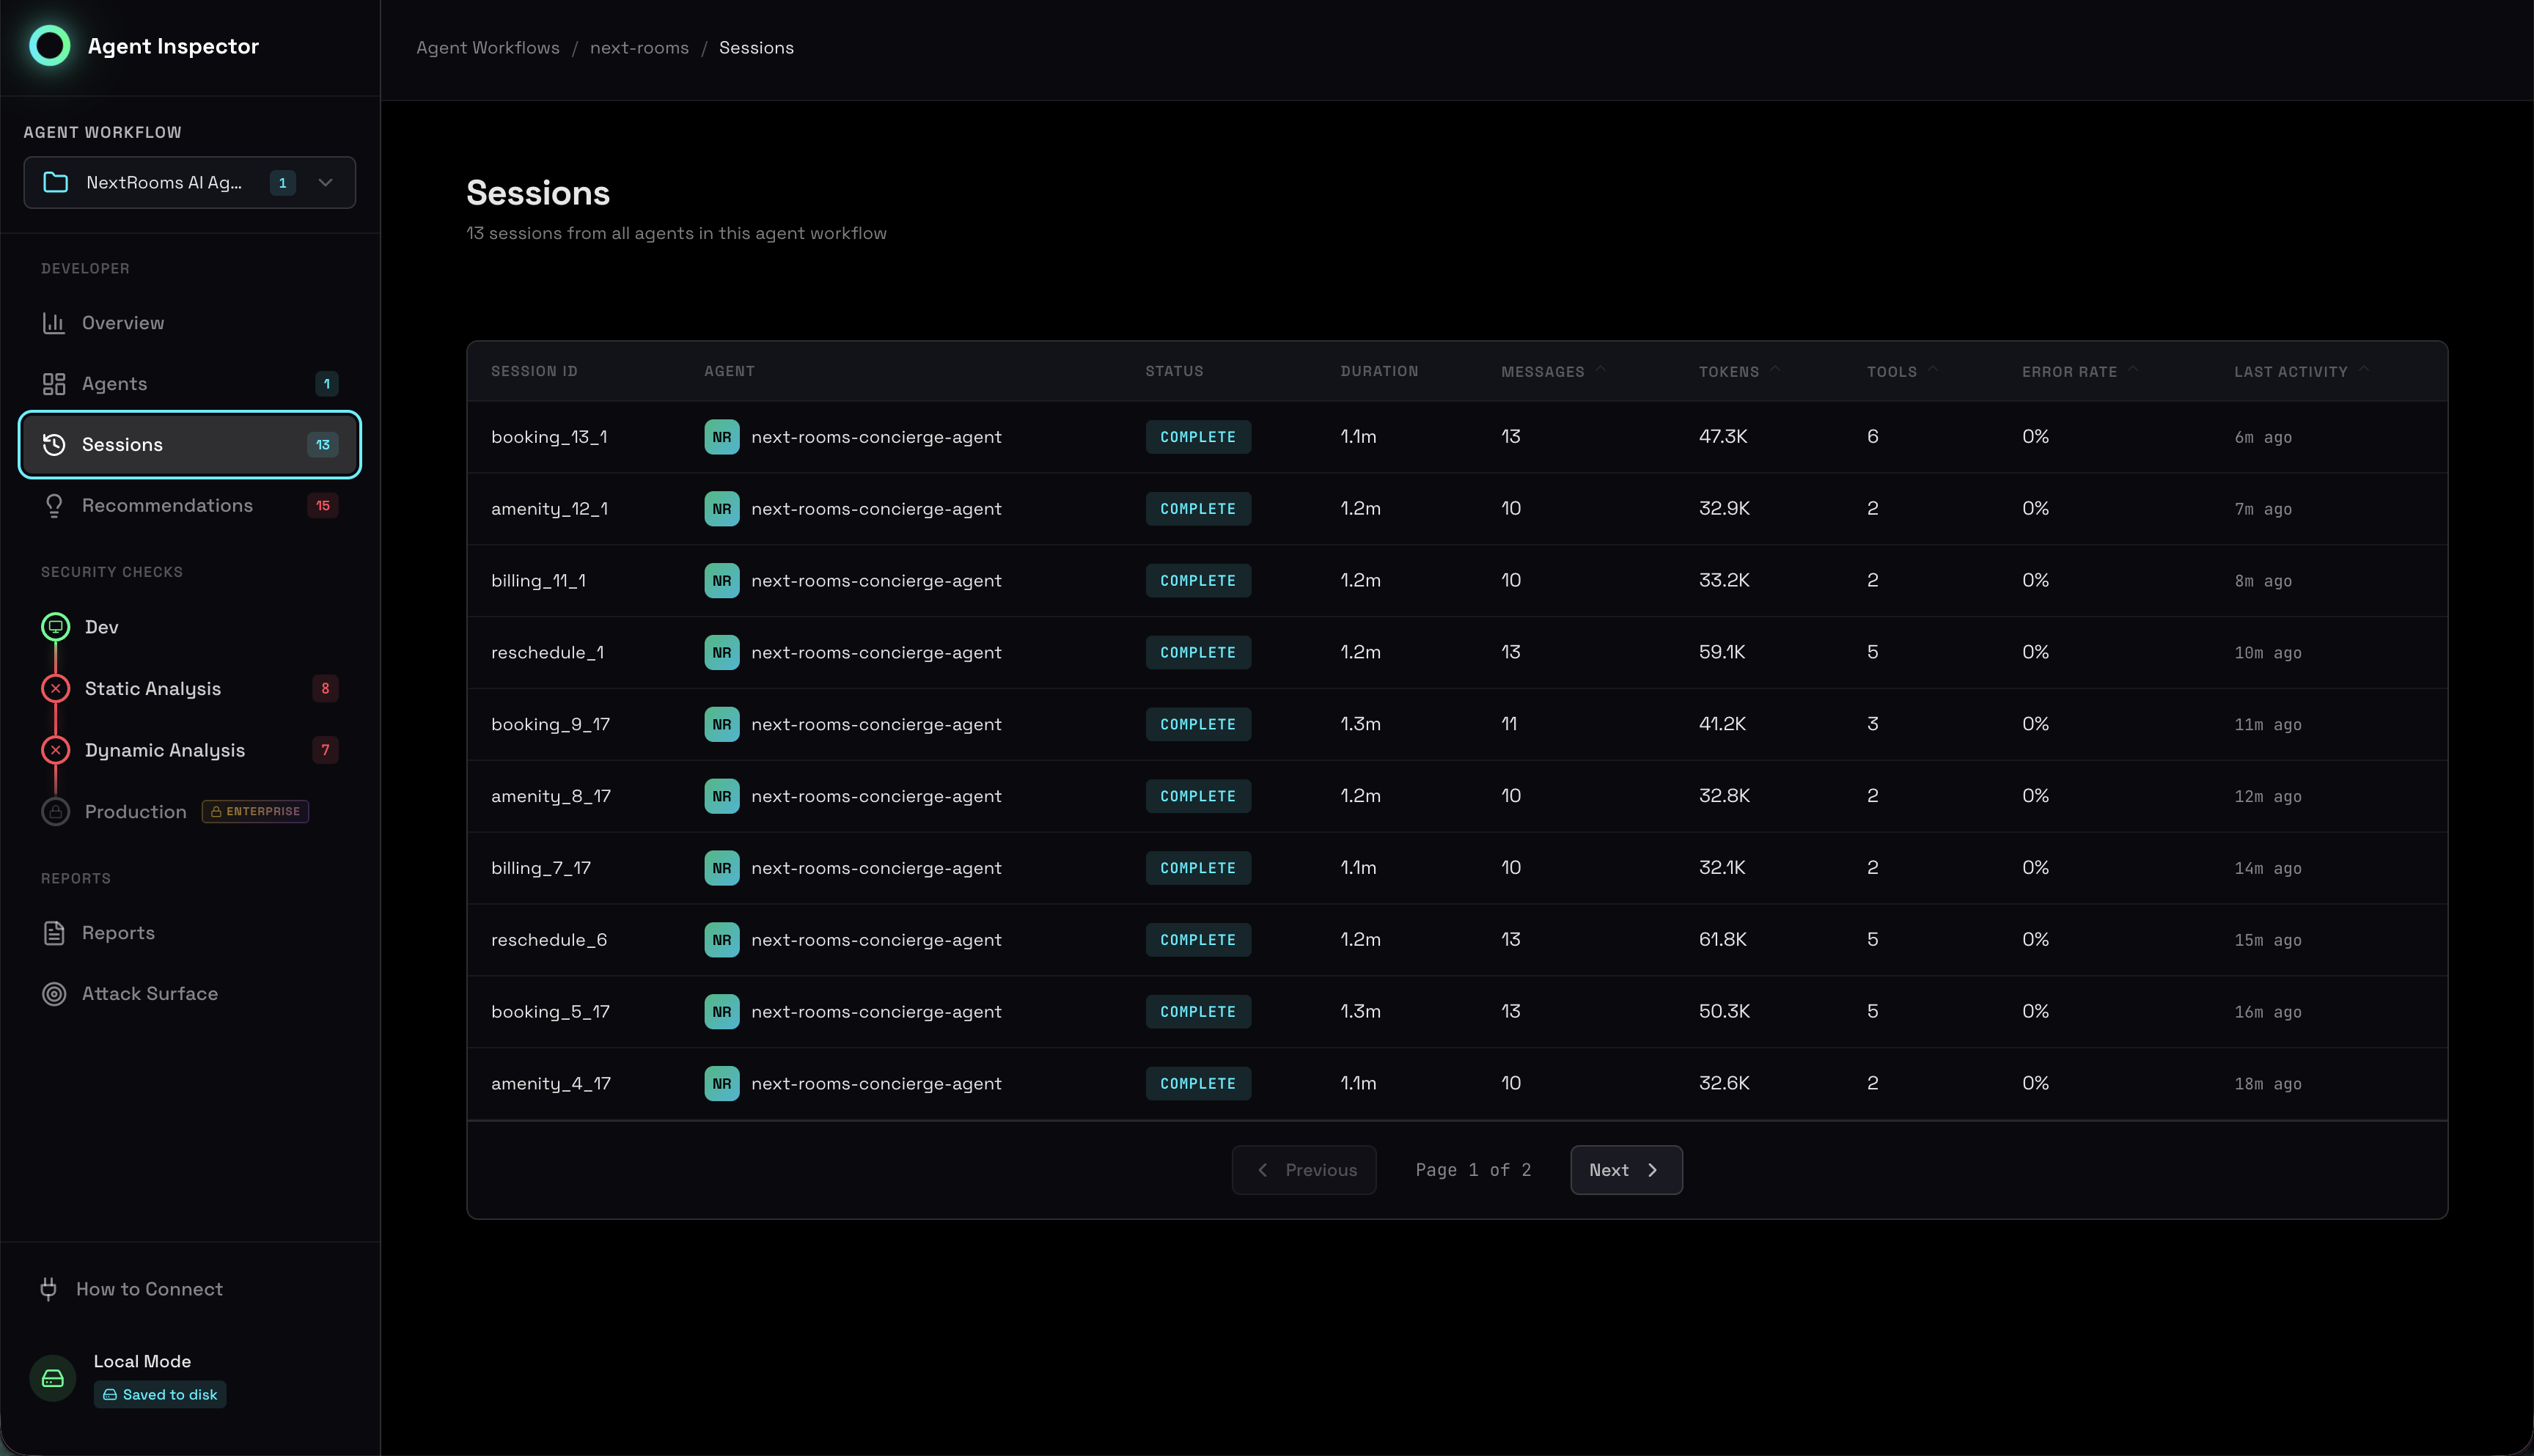
Each session entry displays critical execution metadata:
- Session ID: Unique identifier for tracing and debugging
- Timestamp: When the session was executed
- Status: Completed successfully, failed, or timed out
- Duration: Total execution time from start to finish
- Messages: Number of LLM interactions in this session
- Tokens: Total tokens consumed (input + output)
- Tools Used: Which tools were invoked and how many times
- Model: LLM model and version used
Detailed Session Inspection
Click into any session for complete execution transparency. The session detail view reconstructs the entire conversation flow, showing the exact sequence of events, tool calls with their parameters and results, token consumption per step, and timing breakdown.
This level of visibility is critical for:
- Debugging unexpected agent behaviors
- Understanding why certain decisions were made
- Identifying inefficient tool usage patterns
- Tracking down performance bottlenecks
- Validating tool call parameters and responses
Token Usage Analytics
Token consumption directly impacts both cost and performance. Agent Inspector provides comprehensive token tracking to help you understand spending patterns, optimize prompts, and make informed decisions about model selection.
Key Metrics
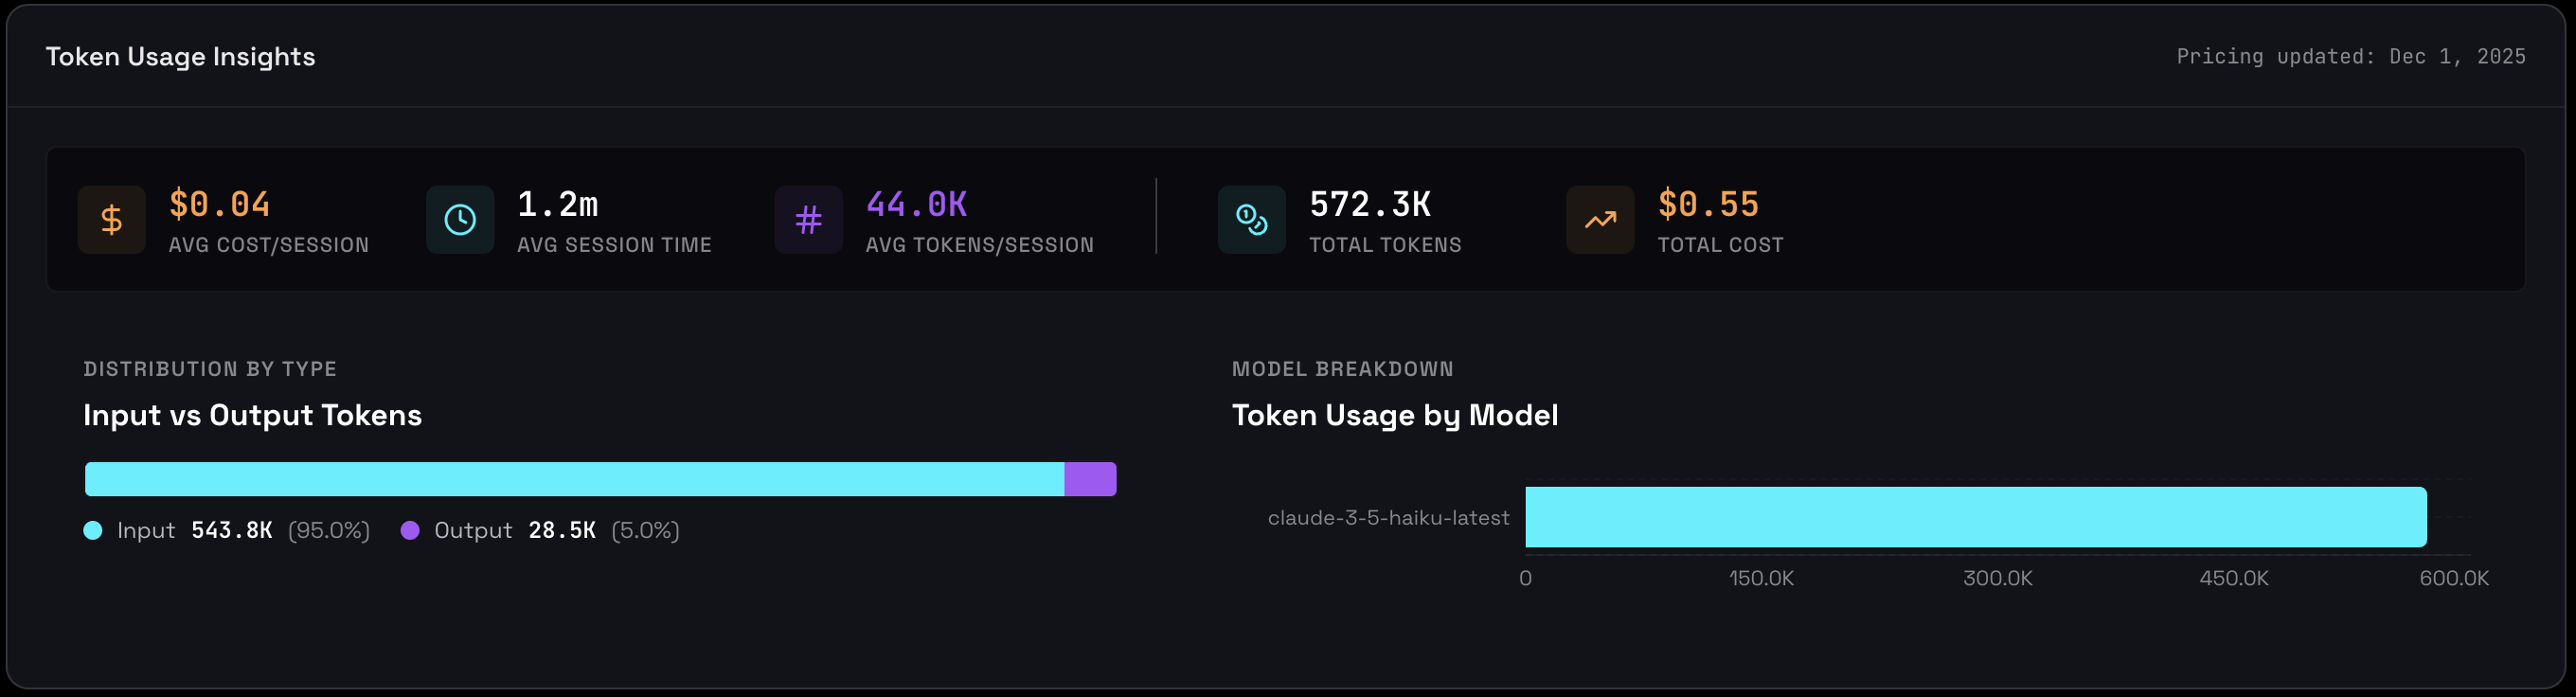
The token usage dashboard shows:
- Total Tokens: Cumulative consumption across all sessions - your overall agent activity volume
- Estimated Cost: Total spending based on current API pricing
- Models Used: Number of unique models, indicating setup complexity
- Input vs. Output Distribution: Visual breakdown showing where your tokens (and money) go
- Token Usage by Model: Top 5 models ranked by consumption with input/output split
Input vs. Output Tokens
This chart shows how your tokens are split between input (sent to the model) and output (generated by the model). Input tokens are your prompts, context, and tool results. Output tokens are the model's responses.
For most modern LLMs, output tokens are often priced higher per token than input, so this ratio has a direct impact on your total spend (exact prices depend on the specific model you're using).
What "Healthy" Ratios Look Like
These are typical patterns, not strict rules:
- 40-60% input / 40-60% output
Balanced usage. Common for many general-purpose agents. - High output (70%+ of total tokens)
Response-heavy agents: chat assistants, content generators, report writers.
→ You're paying mostly for generation. - High input (70%+ of total tokens)
Context-heavy agents: analyzers, RAG/search pipelines, classifiers, auditors.
→ You're paying mostly to feed the model large contexts.
Cost Considerations
If you see very high output share on expensive models, it likely means:
- Long, verbose responses are driving most of your cost.
- You can often optimize by:
- Tightening response instructions (shorter or more structured answers).
- Using cheaper models for high-volume, verbose tasks.
- Reserving top-tier models for the steps where quality really matters.
High output isn't "bad" by itself. What matters is whether the pattern matches the job of the agent and your budget.
Optimization Opportunities
If input tokens are very high:
- Reduce system prompt length - remove unnecessary instructions
- Summarize conversation history instead of sending full context
- Remove redundant context or examples
- Use more concise tool descriptions
If output tokens are very high:
- Set stricter
max_tokenslimits - Instruct the agent to be more concise in the system prompt
- Consider if the agent is generating unnecessary explanations
- Use cheaper models for verbose but simple responses
Red Flags to Watch For
- 🚨 Sudden cost spikes - Investigate what changed in your agent or prompts
- 🚨 Very high output ratio with expensive models - Paying maximum rates unnecessarily
- 🚨 Single model dominating when cheaper alternatives exist for some tasks
- 🚨 Tokens per session increasing over time - Context or prompt bloat
Model Usage & Performance
Multi-model agents are increasingly common, but understanding which models are being used, why, and how they perform is complex. Agent Inspector tracks model selection patterns and performance characteristics across all sessions.
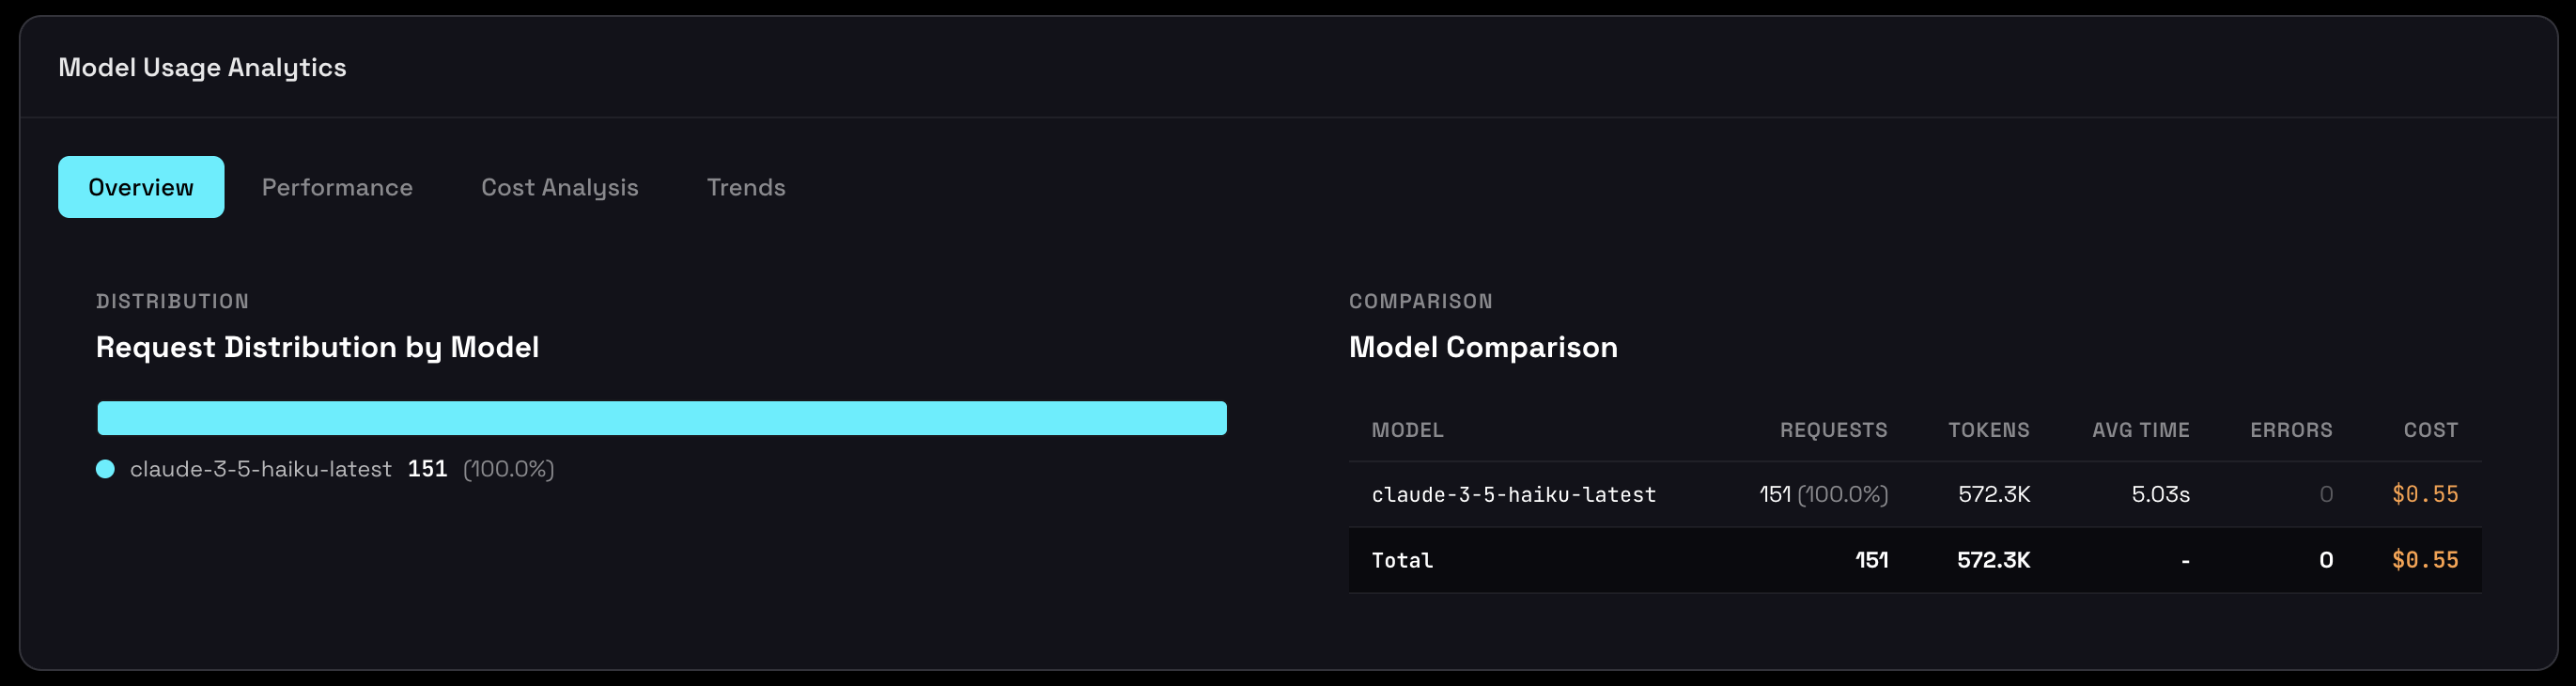
Model Distribution
See which models your agent uses and how frequently:
Model usage tracking reveals:
- Model Adoption: Which models are being used across sessions
- Selection Frequency: How often each model is chosen
- Model Versions: Track version consistency and detect unintended upgrades
- Multi-Model Patterns: Understand when and why model switching occurs
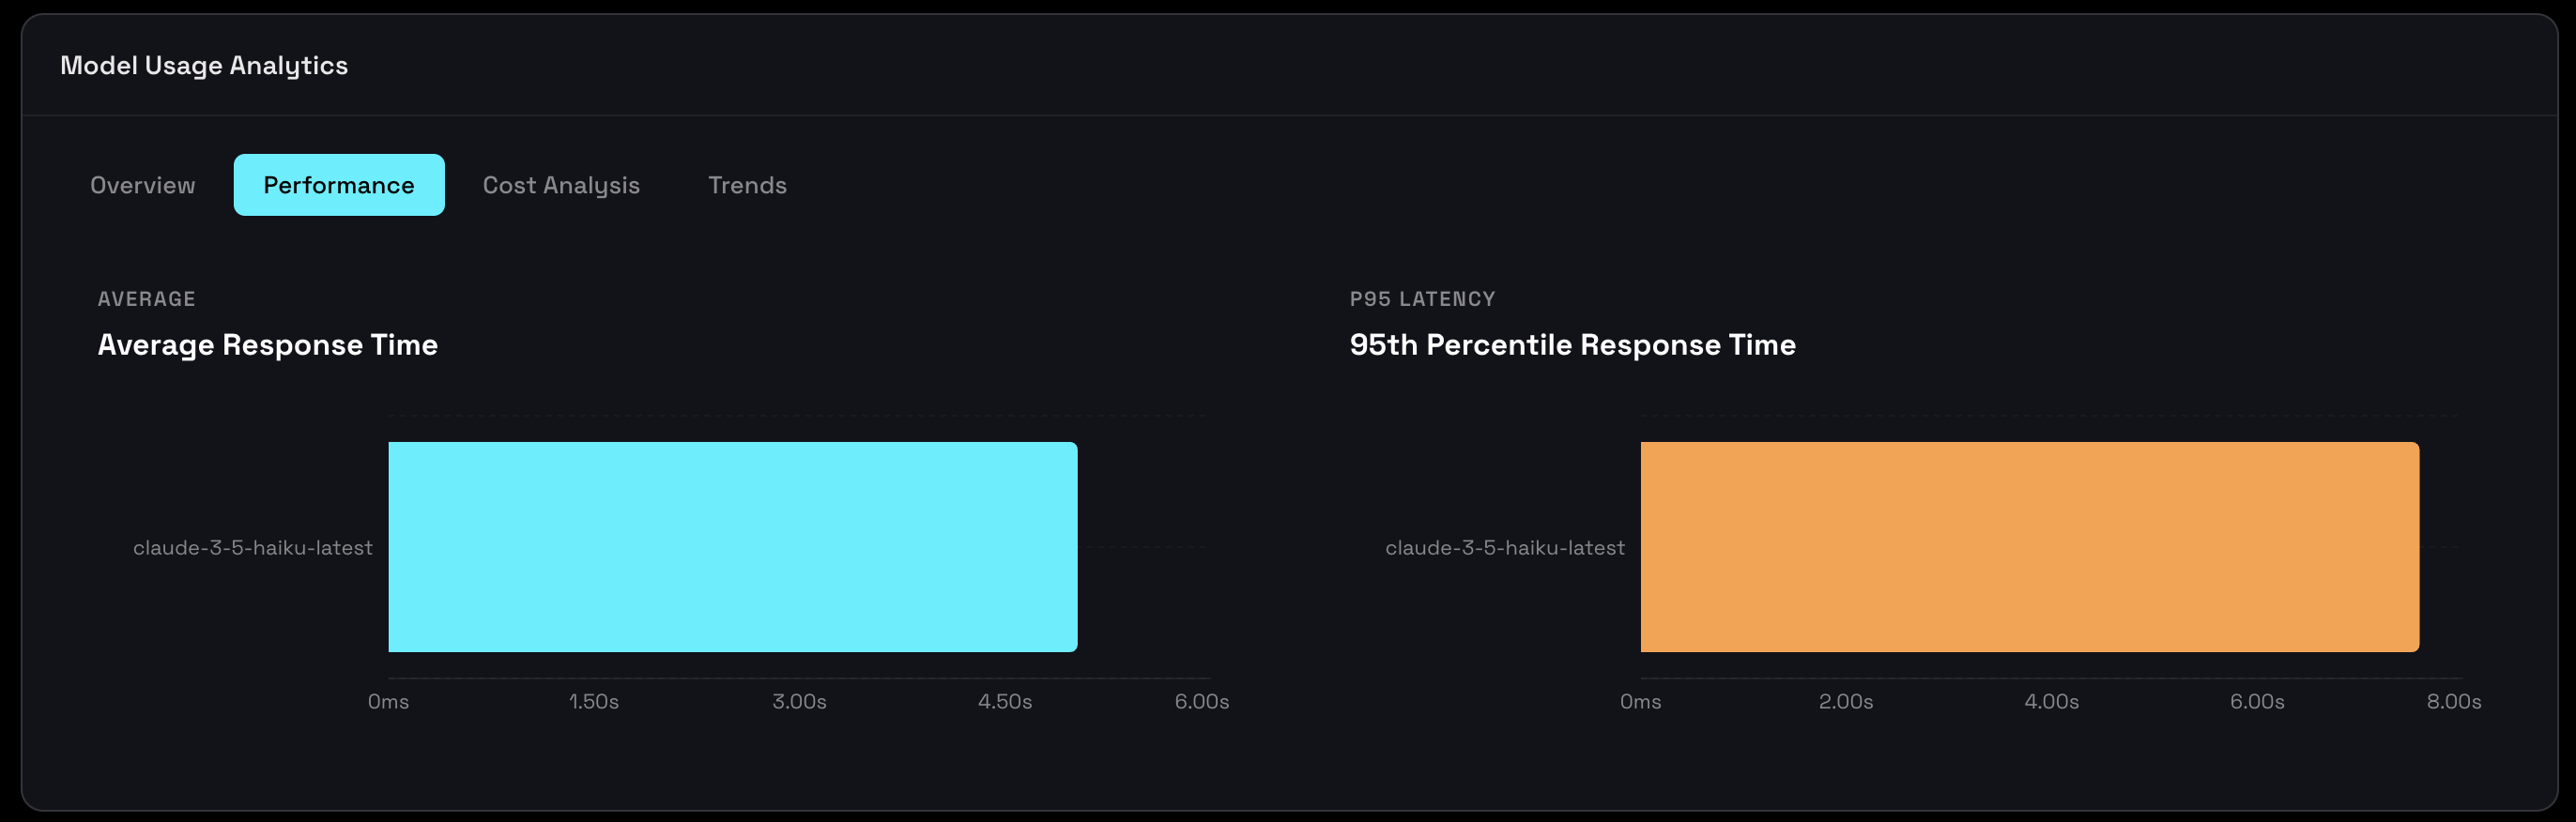
Model Performance
Compare response times across models to spot performance bottlenecks and keep a consistent user experience. This view shows both Average and P95 (95th percentile) response times.
How to Read This Chart
Each model displays two bars:
- Average Response Time - Typical response duration across all calls.
- P95 Response Time - The time under which 95% of requests complete (i.e., the slowest 5% of responses your users see).
Why P95 Matters
Averages can hide serious issues. A model with a 1.5s average might still have a P95 of 8s, meaning 1 in 20 requests is painfully slow.
P95 surfaces inconsistent performance that the average masks, and is critical for:
- SLA design
- User experience guarantees
- Alerting and capacity planning
What to Look For
Use these as rules of thumb (not hard rules):
- P95 < 2× Average → ✅ Consistent, predictable performance
- P95 < 3 seconds → ✅ Good UX for most interactive use cases
- Large gap between Avg and P95 → ⚠️ High variance, investigate causes
- P95 > 10 seconds → 🚨 Users are likely experiencing frustrating delays
Example:
- Model A: Avg 1.2s, P95 2.5s → Consistent, reliable for production
- Model B: Avg 1.5s, P95 8.2s → Unreliable, high variance, needs investigation
Model A is preferable for production not just because it's slightly faster on average, but because its performance is predictable.
Performance Optimization
If all models are slow:
- Reduce unnecessary context (shorten conversation history / retrieved docs).
- Trim long system prompts and templates.
- Use streaming responses to improve perceived latency.
If one model is consistently slower:
- Check that it's used only where its strengths are needed (e.g., complex reasoning, not trivial tasks).
- Consider switching to a faster/cheaper model for time-sensitive paths.
- Investigate whether specific input patterns (very long prompts, large tool outputs, certain tasks) correlate with slow requests.
Cost Analysis
The cost dashboard helps you understand where your money goes across models and workloads:
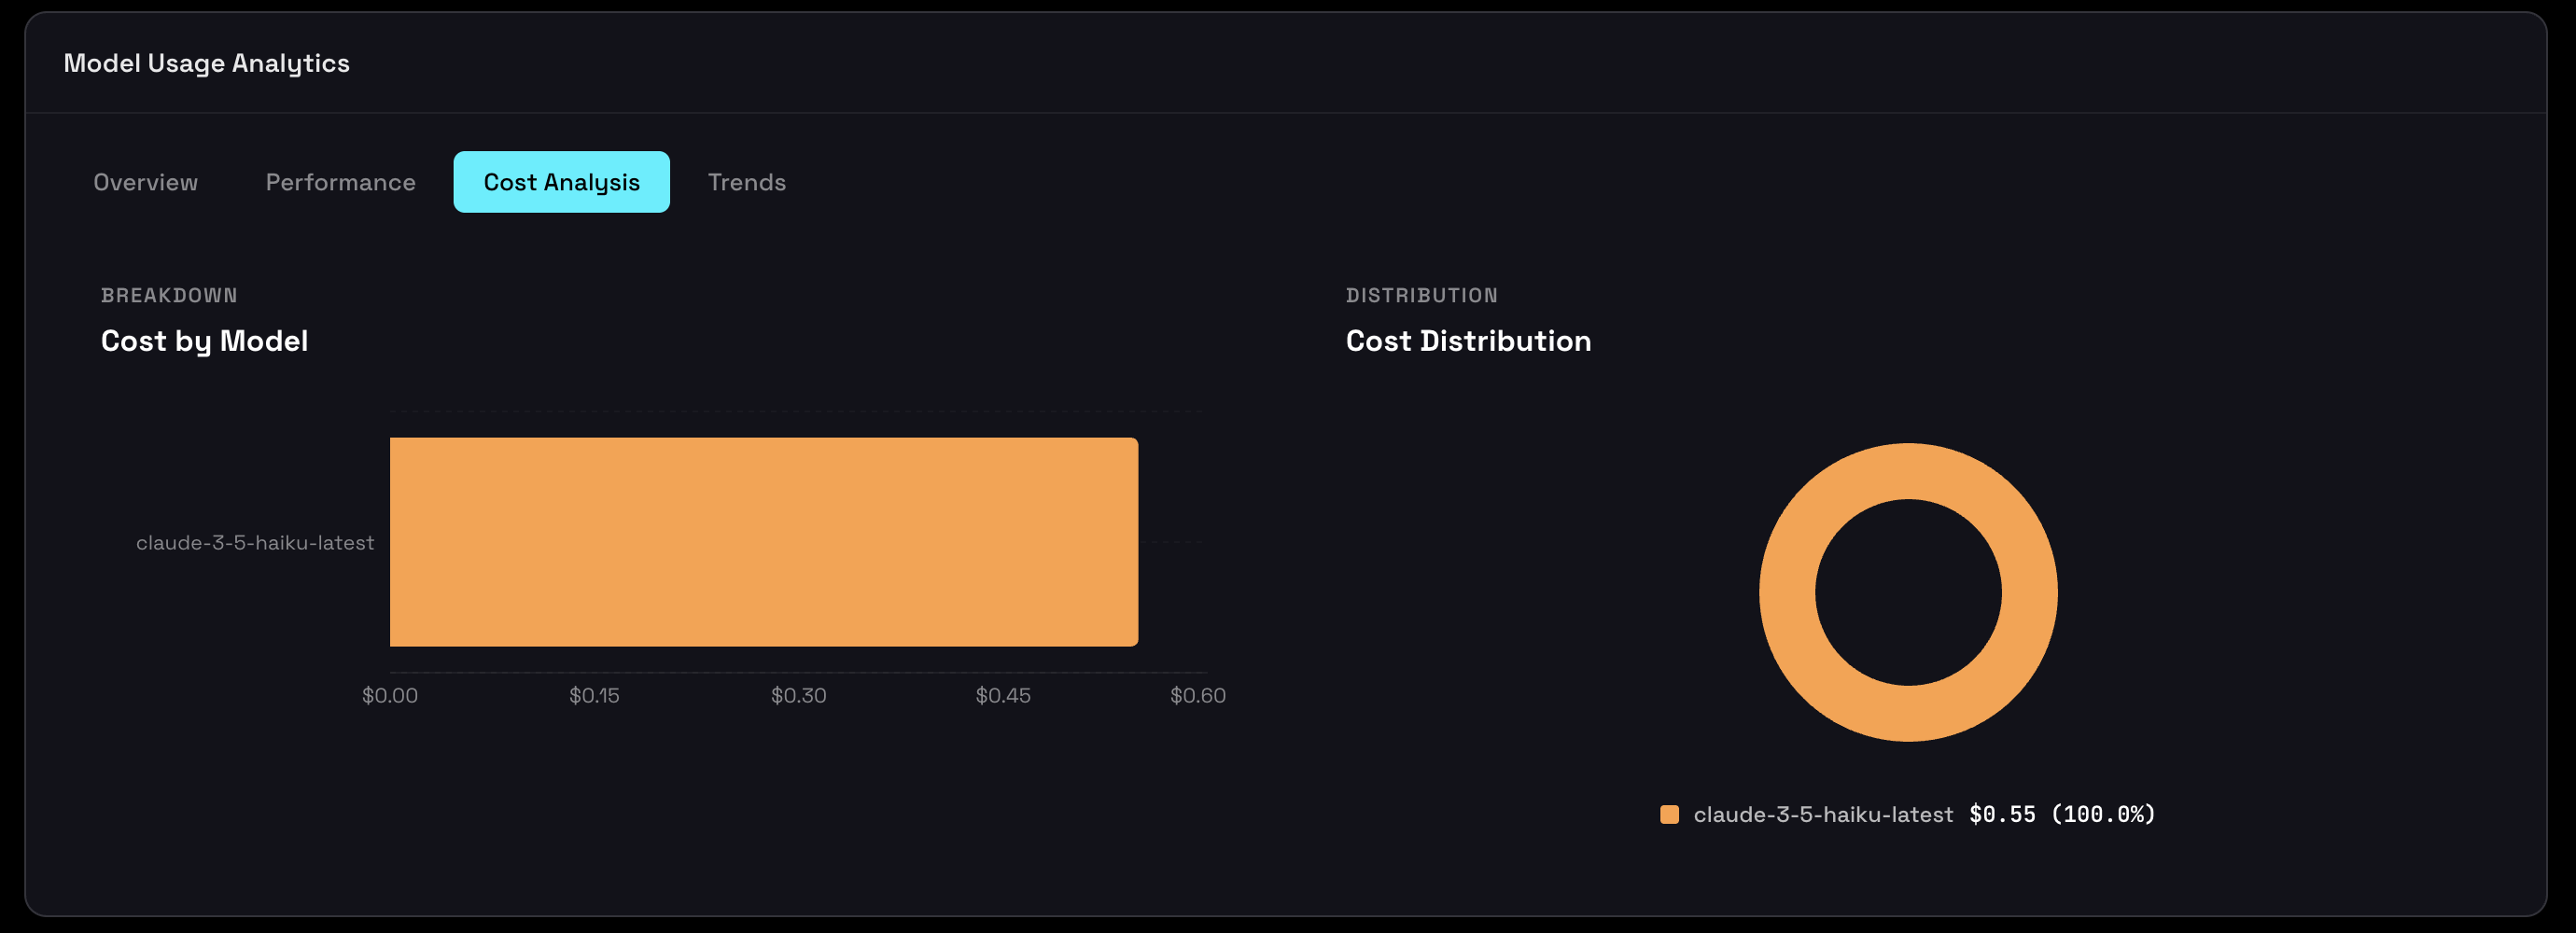
- Total Cost - Cumulative spend across all sessions.
- Cost per 1K Tokens - Effective cost normalized per 1,000 tokens, so you can compare efficiency across models.
- Cost by Model - Per-model breakdown showing total spend and relative efficiency.
- Pricing Updated Date - When pricing data was last refreshed (provider prices can change frequently).
💡 Cost per 1K Tokens
Cost per 1K tokens normalizes spending independent of volume, making models easy to compare side by side.
It answers questions like: "Am I using a premium model where a cheaper one would be good enough?"
This metric is usually calculated as:
(Total cost for the model ÷ Total tokens for that model) × 1,000
It reflects your effective price, including your mix of input/output tokens and any discounts, not just the provider's list price.
Example Analysis
Suppose your dashboard shows:
- GPT-4:
- Total Cost: $35.00
- Tokens: 500K
- Cost per 1K: $0.070
- Claude 3.5 Sonnet:
- Total Cost: $10.67
- Tokens: 400K
- Cost per 1K: $0.027
Observation: GPT-4 is roughly 2.6× more expensive per token.
Action: Test whether Claude 3.5 Sonnet can handle some tasks currently handled by GPT-4 without hurting quality.
Potential Savings: If you move equivalent workloads from GPT-4 to Claude, you can save around 60% on those tokens (e.g., turning a $35 workload into roughly ~$13-14).
Cost Optimization Strategies
Quick Wins
- Use tiered models
Fast/cheap models for simple or high-volume tasks, premium models for complex reasoning and critical paths. - Cache repeated requests
Avoid recomputing responses for identical or highly similar inputs. - Optimize prompts
Shorter, more focused prompts reduce input token costs and can simplify outputs. - Test cheaper alternatives
Many tasks (classification, extraction, basic Q&A) don't need the most expensive model.
Advanced Strategies
- A/B test models
Compare quality vs. cost using real traffic and success metrics. - Implement routing logic
Automatically route requests based on task type, complexity, or user tier (free vs. paid). - Set budget alerts
Monitor spend per project/session and flag sudden spikes or anomalies. - Negotiate volume pricing
If your usage is high, talk to providers about discounts or committed-use pricing.
Model Trends Over Time
Track how model usage and token consumption evolve over time to understand growth patterns, validate optimizations, and catch regressions early.
The timeline chart shows two lines:
- Requests (cyan): How many calls per day
- Tokens (purple): Token consumption per day
Understanding the Trends
When lines are parallel: Consistent token usage per request (healthy, predictable)
When tokens increase faster than requests: Growing prompt sizes or output length - investigate why
When requests spike: Usage growth or event-driven activity - is it expected?
Example Analysis
Day 1: 100 requests, 50K tokens = 500 tokens/request
Day 7: 150 requests, 112K tokens = 747 tokens/request

Tokens per request increased 49% → investigate prompt changes
Using Trends for Planning
- Capacity Planning: Extrapolate growth rate for budgeting future costs
- Performance Monitoring: Spot degradation before it becomes critical
- Validate Optimizations: Confirm that changes actually reduced costs
- Correlate with Deployments: See how code changes affect behavior
Example Optimization Validation:
Before: 200K tokens/day @ $5.60/day
After:  150K tokens/day @ $3.20/day
Result: 43% cost reduction ✅
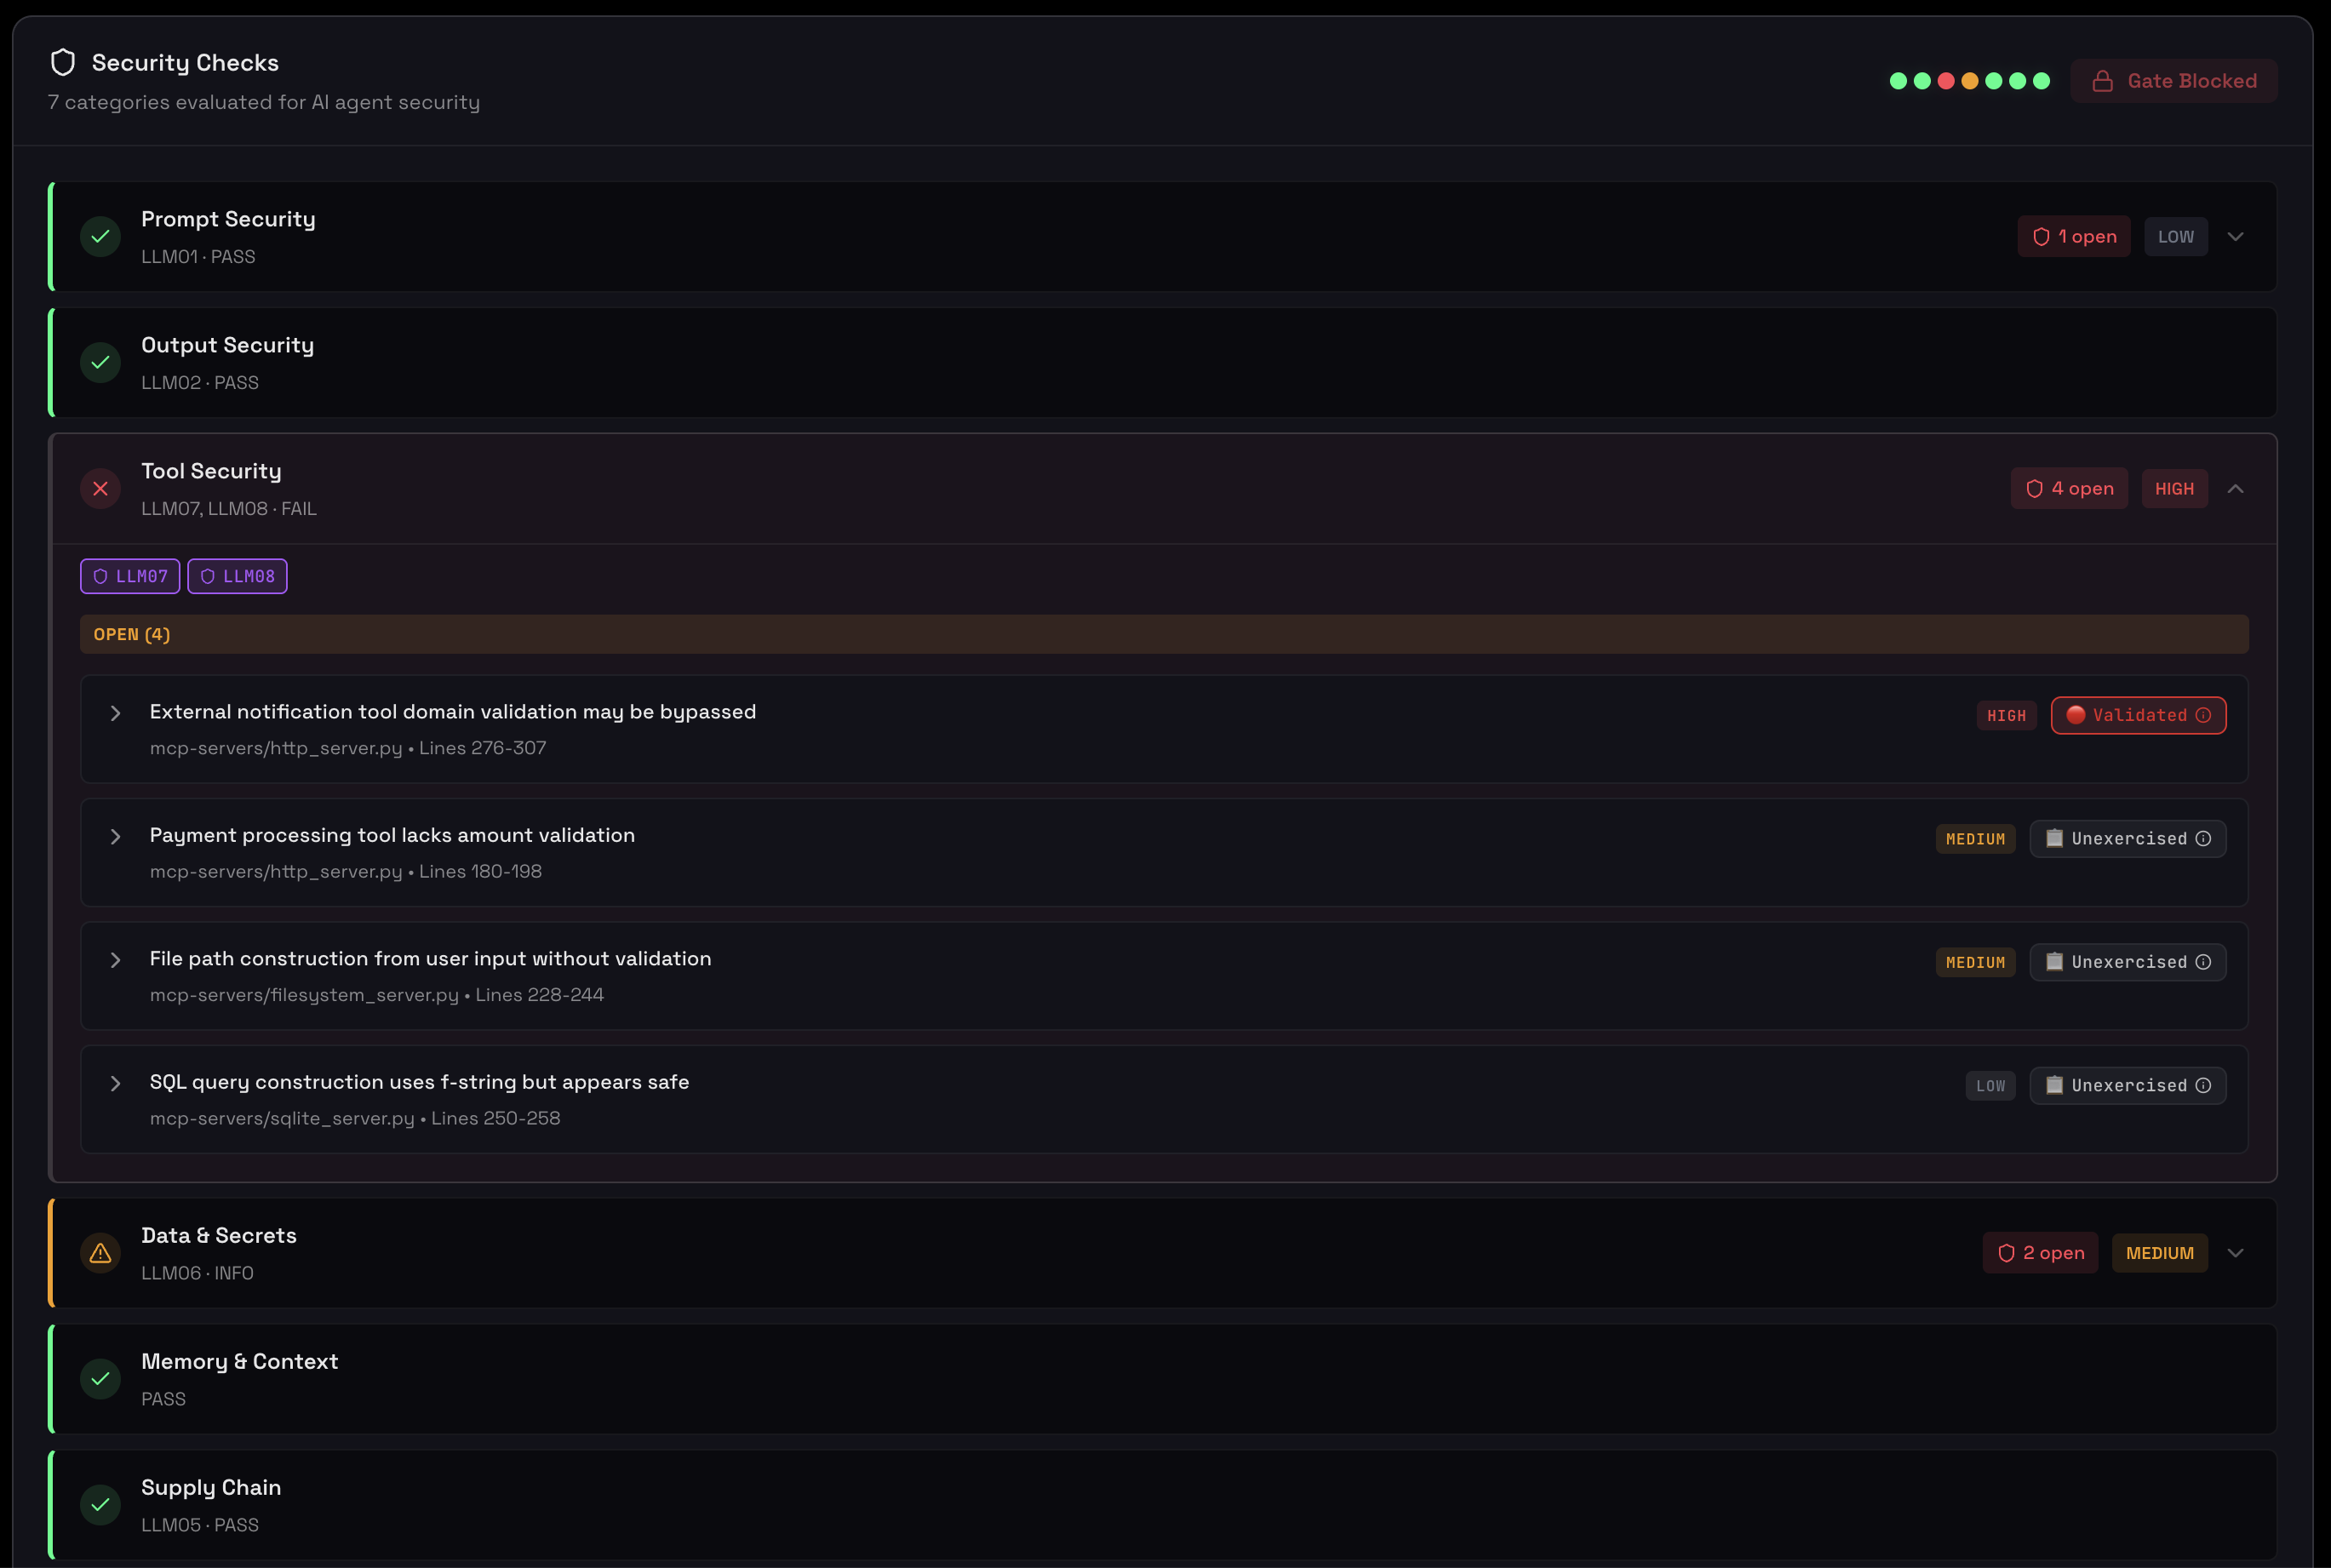
Tool Usage & Performance
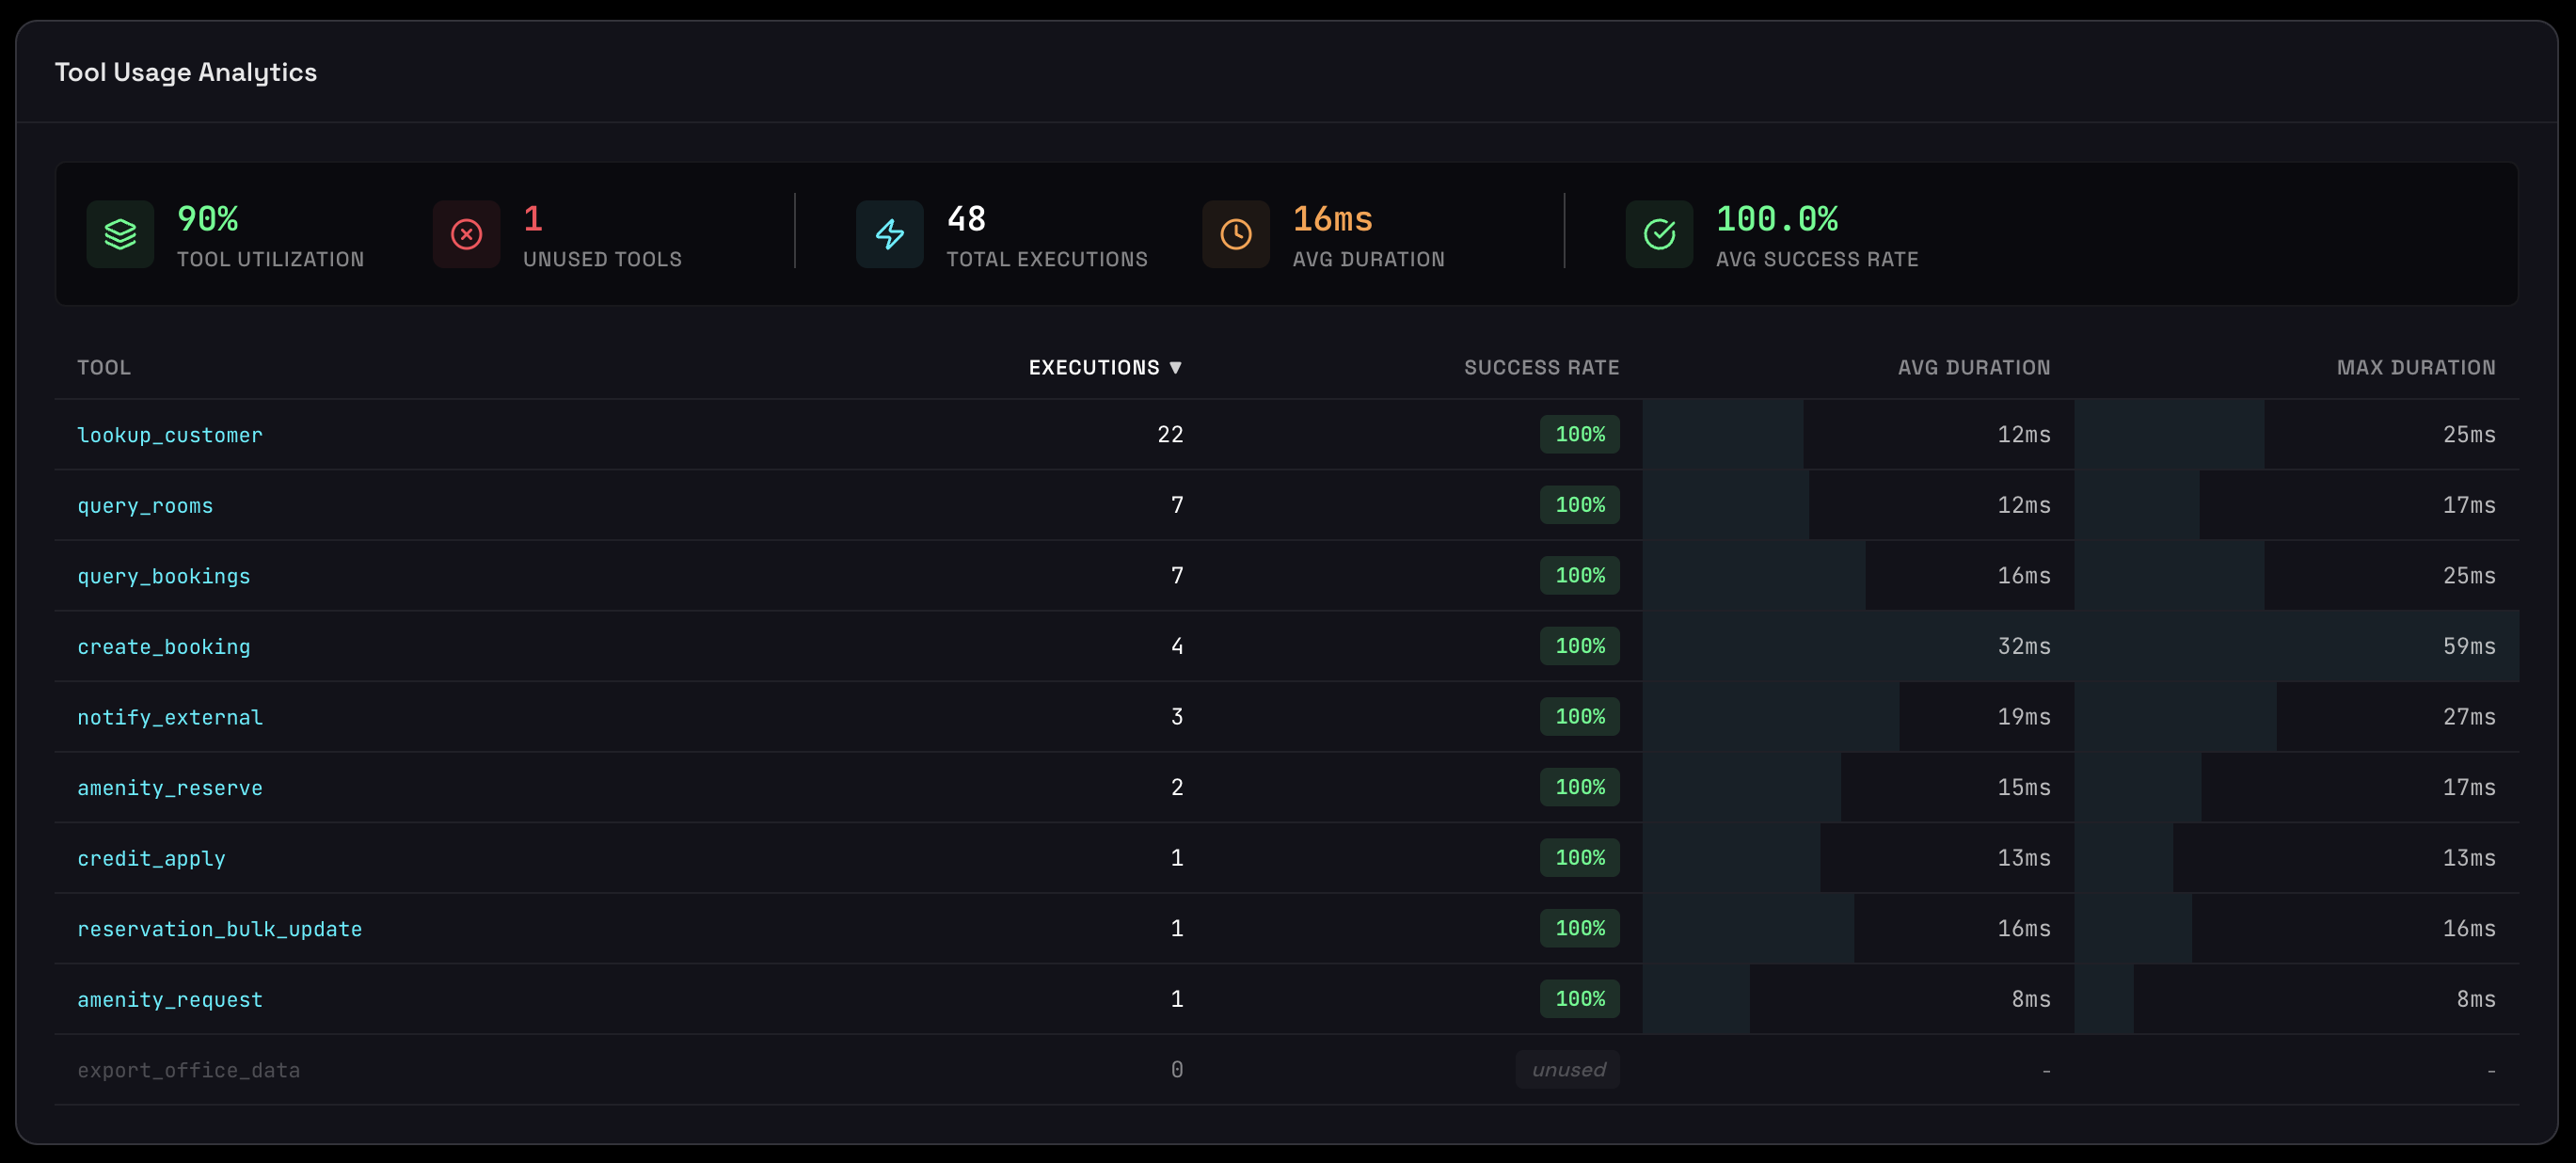
Tools are how agents interact with the world: file systems, APIs, databases, and external services. Understanding which tools are used, how often, and how well they perform is critical for optimizing agent behavior, controlling costs, and avoiding performance bottlenecks.
Tool Adoption & Frequency
A ranked list of all tools showing execution frequency, revealing your agent's "core functions" and identifying unused capabilities.
Each tool displays:
- Tool Name: Identifier for the function or API
- Visual Bar: Relative frequency (longest bar = most frequently used)
- Execution Count: Exact number of times this tool was called
What This Reveals
Identify unused tools:
get_weather: 450 calls
get_news: 23 calls
get_stocks: 0 calls  ← Remove this - adds cognitive load for no benefit
Spot inefficiency:
search_database: 890 calls
cache_lookup: 12 calls  ← Cache should be much higher!
→ Agent isn't using cache effectively
Validate expected behavior:
For a customer support agent:
lookup_ticket: 234 calls ✅ (expected high)
create_ticket: 45 calls ✅ (expected lower)
delete_ticket: 89 calls ⚠️ (investigate why so many deletions)
Every tool you define adds to the context sent with each LLM call. Unused tools waste tokens, increase costs, and add cognitive load to the model. Removing unused tools makes your agent faster, cheaper, and often more accurate.
Slow Tool Detection
Tools ranked by execution time to help you identify and fix performance bottlenecks. Slow tools directly impact user experience and can make your agent feel unresponsive.
Each tool shows:
- Average Duration: Typical execution time
- Max Duration: Worst-case performance (can indicate timeouts or stuck calls)
- Failure Rate: Percentage of calls that fail (if > 0%)
- Color Coding: Red (slowest) → Yellow (moderate) → Green (fastest)
Latency zones for interactive agents:
- ~0-100ms: Feels instant; below the threshold of conscious delay
- ~100-300ms: Still feels very fast / snappy for most interactions
- ~300-800ms: Noticeable, but usually acceptable if something visibly happens
- ~800ms-2s: Clearly "waiting", but tolerable for heavy operations
- >2s: Starts to feel slow; >5s is "something might be broken"
- Max in hundreds of seconds: Indicates timeouts or blocking operations
Understanding Failure Rates
Failure rates indicate tool reliability and are shown as a percentage on the bar:
- 0-5%: ✅ Acceptable - likely transient errors, monitor
- 5-10%: ⚠️ Warning - investigate patterns, add retry logic
- 10-20%: 🚨 Problem - serious reliability issue
- 20%+: 🔴 Critical - tool is broken, fix immediately or disable
- API rate limits being exceeded
- Network timeouts (tool takes too long)
- Invalid parameters from agent (malformed tool calls)
- External service downtime
- Authentication or permission issues
How to Fix Slow Tools
If a tool is slow (consistently >2 seconds):
- File & I/O tools: Avoid reading huge files synchronously, stream large results, add size limits
- External API calls: Cache results when possible, use async/parallel calls, set timeouts
- Database queries: Add indexes, optimize queries, use connection pooling
Example Optimization:
Before: get_user_profile - 3.2s avg (database query every call)
After:  get_user_profile - 0.1s avg (Redis cache, 5min TTL)
Result: 97% faster ✅
If failure rate is high:
- Check if tool timeout is too short (increase it)
- Add better error handling and retry logic
- Validate tool call parameters before execution
- Monitor external service status
- If >20% failure, consider disabling tool until fixed
Execution Trends
Visualize how tool usage evolves over time to detect patterns, validate optimizations, and understand how agent behavior changes with updates. Select up to 3 tools to compare simultaneously.
The multi-line chart shows:
- Colored lines: One per selected tool
- Data points: Actual daily execution counts
- Gradient fill: Emphasizes trend direction
What Trends Reveal
Usage Patterns:
Tool A (blue):   Flat line → Stable core functionality
Tool B (purple): Growing → New feature gaining adoption
Tool C (green):  Declining → Being phased out or losing relevance
Correlation Between Tools:
search_database ↑ (increasing)
cache_lookup → (flat)
→ Problem: Cache isn't scaling with searches, investigate why

create_order ↑ (increasing)
send_confirmation ↑ (increasing at same rate)
→ Good: Tools working together as expected
Anomaly Detection:
Normal: ~50 calls/day
Spike: 450 calls/day on Nov 15
→ Investigate: Bug? Feature launch? Attack attempt?
Using Trends for Decisions
Capacity Planning:
Tool A growing 20% week-over-week
Current: 1,000 calls/day
Projected (4 weeks): 2,074 calls/day
→ Ensure tool can handle 3,000+/day
Feature Validation:
Deployed new search on Nov 10
search_advanced: 0 → 150 calls/day within 5 days
→ Feature successfully adopted ✅
Cost Optimization:
expensive_api: 500 calls/day @ $0.10 = $50/day
cheap_alternative: 50 calls/day @ $0.01 = $0.50/day

After promoting alternative:
expensive: 200 calls/day = $20/day
cheap: 350 calls/day = $3.50/day
→ Savings: $26.50/day (53%) ✅
Using These Views for Decisions
- Refine tool sets: Remove unused tools and simplify the agent's toolbox
- Optimize performance: Focus on tools with high latency and high call volume
- Validate changes: After deployments, watch trends to confirm tools are used as expected
- Control costs & risk: High-volume, slow, or error-prone tools are prime candidates for caching or redesign