Behavioral Analysis
Understand how your agent behaves across different scenarios with automated clustering, outlier detection, and quantitative stability metrics.
Overview
Unlike traditional testing that validates functionality ("does it work?"), behavioral analysis evaluates predictability ("will it stay within expected boundaries?"). This is critical because AI agents are non-deterministic - they make autonomous decisions that can drift over time, even with identical code and prompts.
Agent Inspector's behavioral analysis establishes your agent's behavioral perimeter - the range of acceptable operational patterns. It combines consistency metrics, stability scores, and outlier detection to catch both immediate anomalies and slow behavioral drifts before they reach production. Without this analysis, you're deploying blind to how your agent will actually behave at scale.
Behavioral Clustering
After running multiple sessions, Agent Inspector automatically groups them into behavioral clusters based on tool usage patterns, execution flow, and resource consumption. This reveals distinct operational modes and helps you understand how your agent actually behaves in practice.
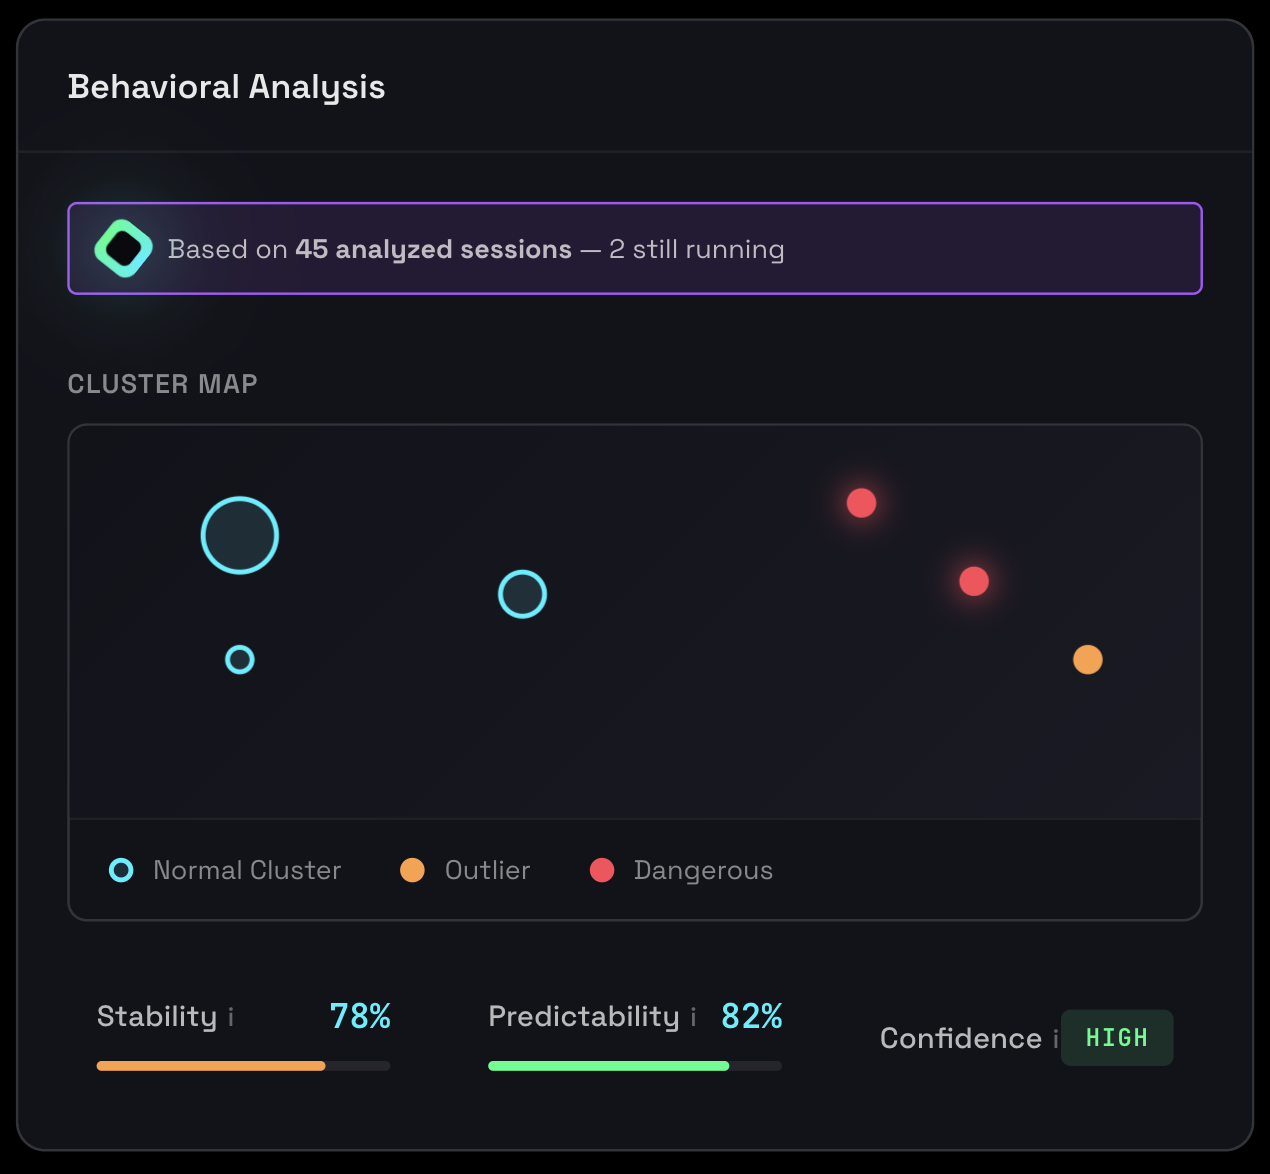
Behavioral clustering showing distinct operational patterns and session distribution
Understanding Clusters
Each cluster represents a distinct "mode" of operation. For example, an agent might have:
- Cluster 1 (70% of sessions): Simple queries answered directly without tools
- Cluster 2 (20% of sessions): Complex queries requiring multiple tool calls
- Cluster 3 (10% of sessions): Error recovery and retry patterns
What Clustering Reveals
Operational Modes
How many distinct ways your agent operates and the distribution between them
Dominant Patterns
Which behavioral patterns are most common vs. rare edge cases
Consistency
Whether most sessions follow similar patterns or if behavior is scattered
Complexity
Whether your agent has simple, predictable behavior or complex multi-modal operation
Cluster Distribution Interpretation
✓ Good: Single Dominant Cluster (≥60%)
Most sessions follow the same pattern. Highly consistent, predictable behavior that's production-ready.
⚠️ Acceptable: Few Balanced Clusters (2-3)
Multiple operational modes are fine if each is intentional and well-defined. Document each mode's purpose.
✗ Problem: Many Small Clusters (≥4)
Unpredictable behavior indicating unclear agent design. Refine prompts or split into separate agents.
How Clustering Works
Agent Inspector uses advanced clustering algorithms to efficiently group similar sessions at scale. Each session is converted into a behavioral signature based on:
- Tool call sequences and patterns
- Resource utilization (tokens, time)
- Response characteristics
- Error patterns and recovery
- Execution flow and decision points
Outlier Detection
Sessions that don't fit into any major cluster are flagged as outliers. Each outlier receives deterministic root cause analysis identifying exactly why it deviated from normal patterns.
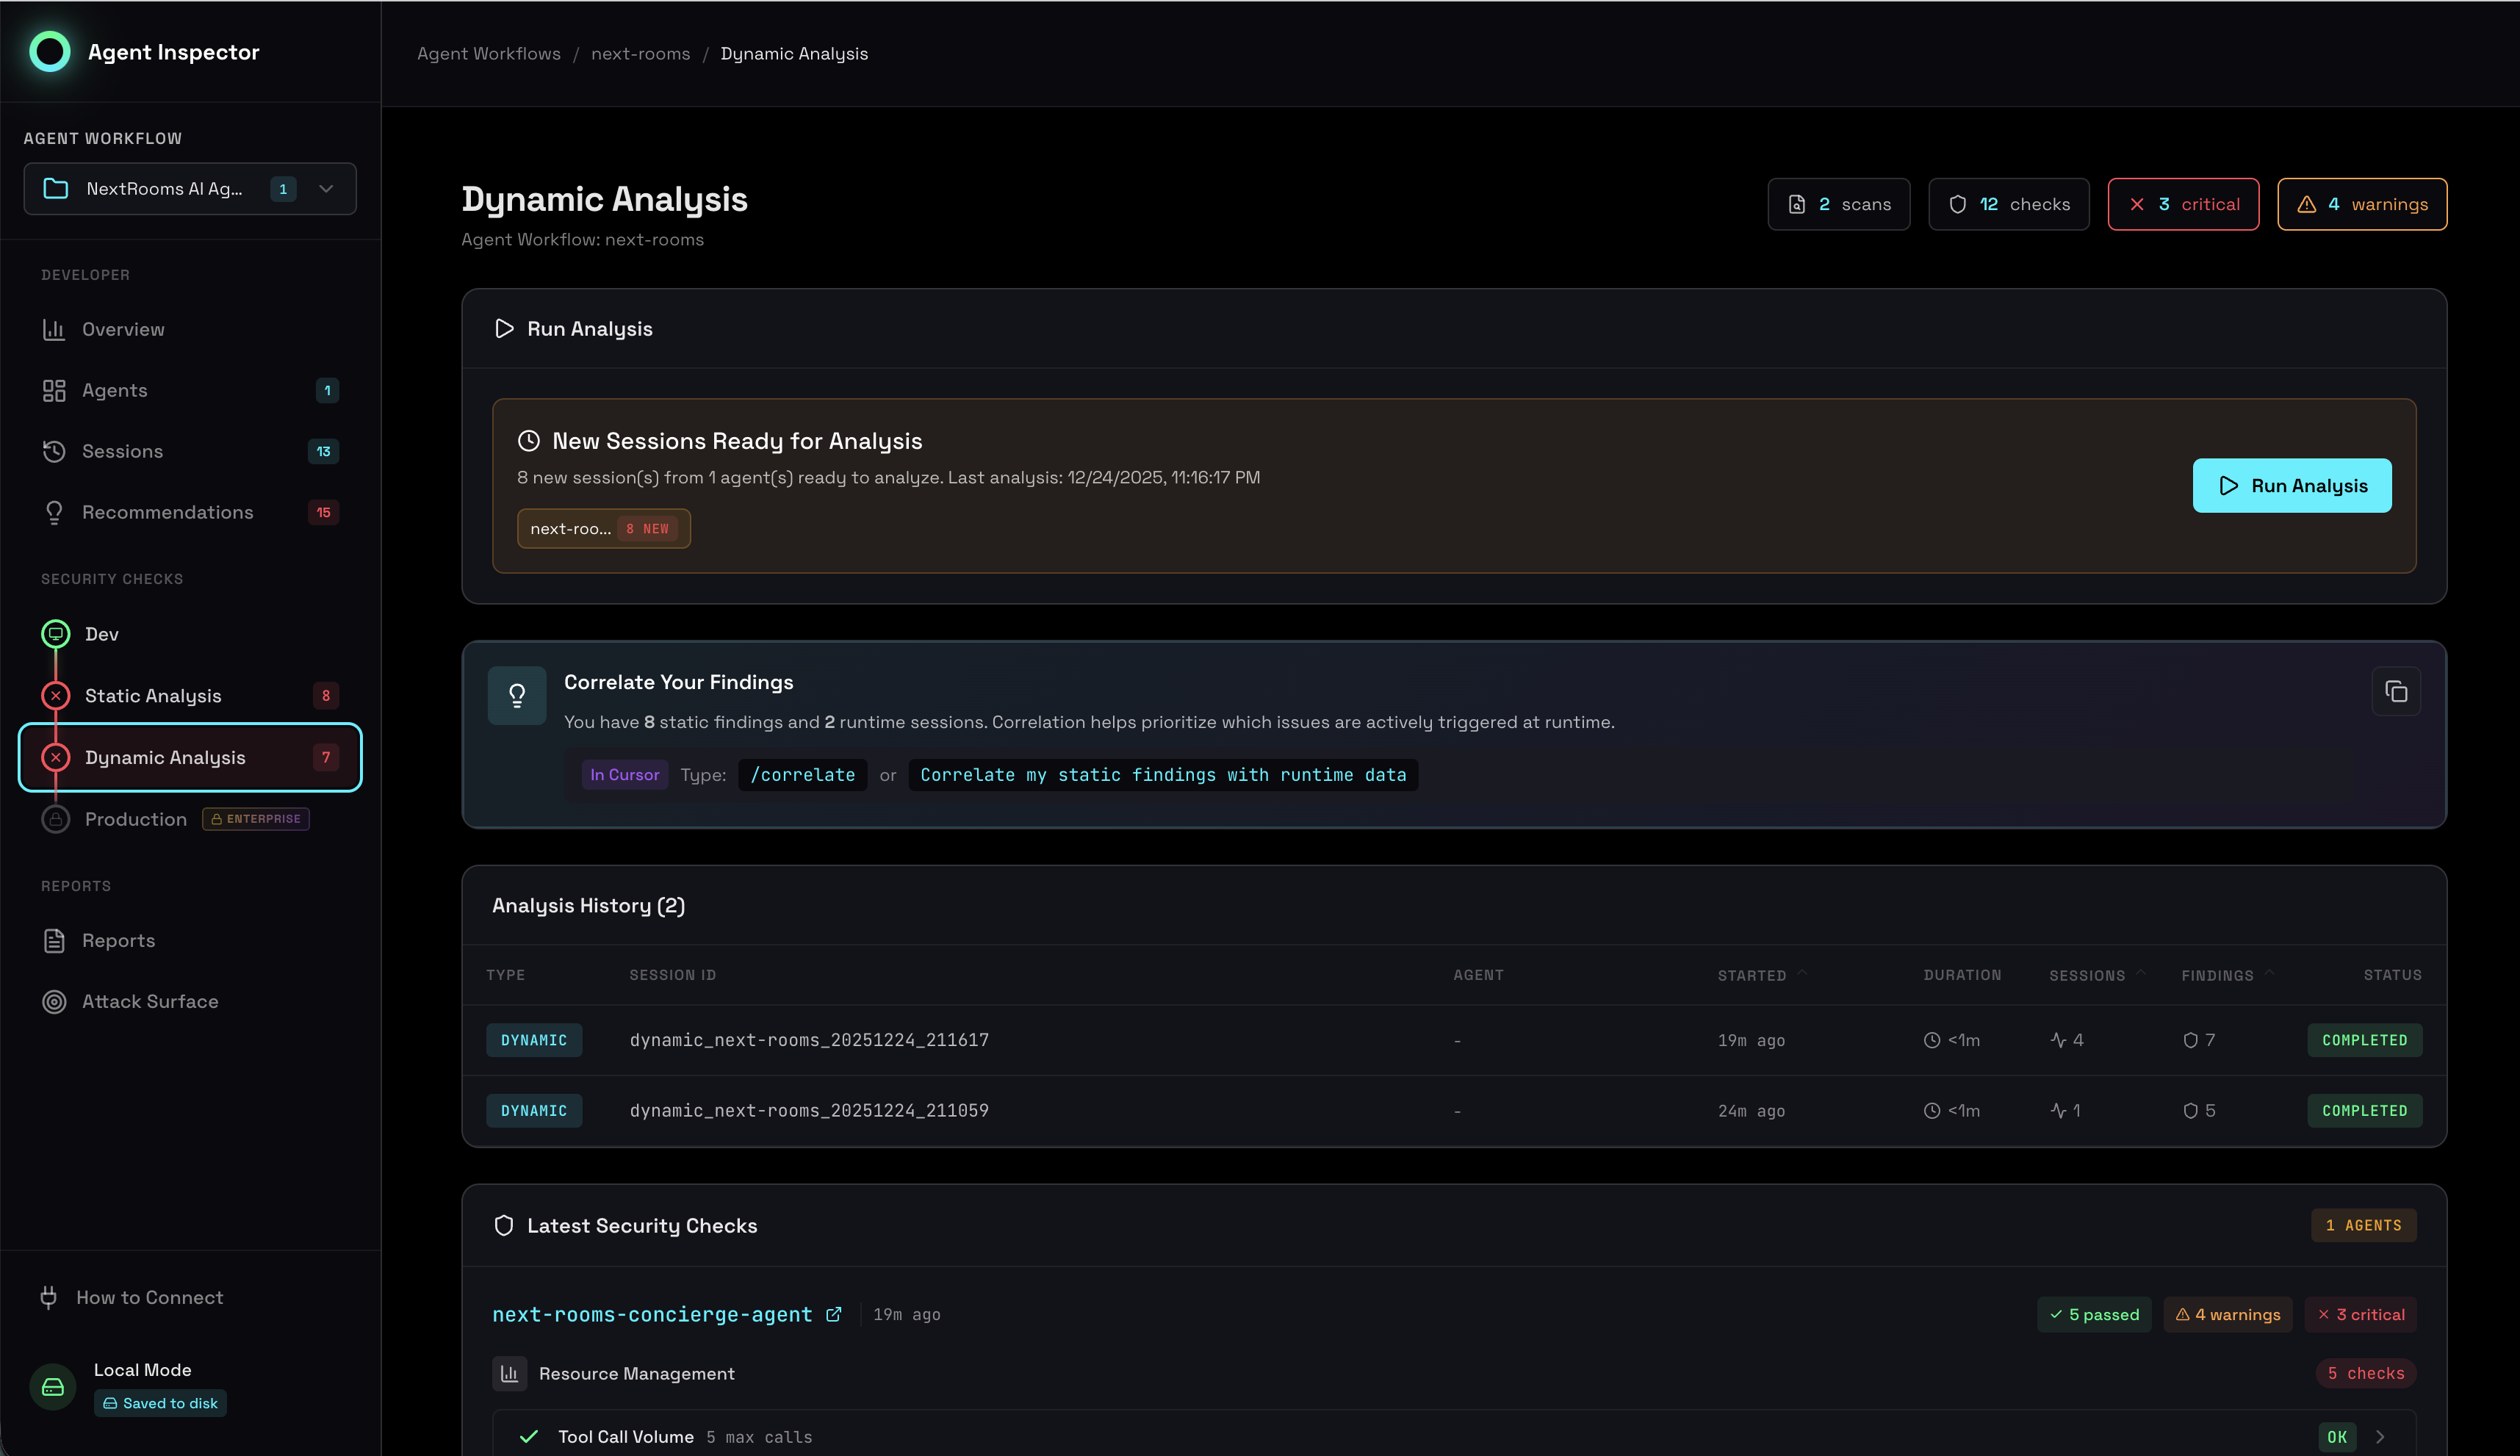
Detailed outlier detection with root cause analysis for anomalous sessions
What Are Outliers?
Outliers are sessions with Jaccard similarity < 0.4 to any cluster centroid. They represent anomalous executions that deviate significantly from normal patterns.
Why Outlier Detection Exists
- Anomaly Detection: Identifies when your agent behaves unexpectedly
- Security: High outlier rates may indicate prompt injection or adversarial inputs
- Quality Control: Helps catch edge cases that need handling
- Capacity Planning: Outliers often use more resources (tokens, latency)
Common Outlier Indicators
- Edge cases you didn't anticipate during development
- Error conditions that need better handling
- Inputs that confuse the agent or trigger unexpected behavior
- Performance anomalies or resource spikes
- Unexpected tool call sequences or missing standard tools
Root Cause Analysis
For each outlier, Agent Inspector provides deterministic analysis showing:
Deviation Details
Which specific features deviated from normal ranges (tokens, tools, timing)
Tool Call Differences
Unusual tool calls or sequences not seen in typical sessions
Resource Anomalies
Token usage spikes, execution time outliers, or excessive iterations
Error Patterns
Tool failures, timeouts, or errors that caused behavioral deviation
Outlier Rate Interpretation
| Outlier Rate | Assessment | Action Required |
|---|---|---|
| 0-5% | Excellent | Very few anomalies (HIGH confidence) |
| 6-10% | Good | Some edge cases (MEDIUM confidence) |
| 11-19% | Acceptable | Notable anomalies (PASSES but monitor) |
| ≥20% | CRITICAL | Too many unpredictable sessions (FAILS gate) |
When Outlier Rate is High (≥20%)
Root Causes:
- Diverse input patterns: Users submitting widely varying requests
- Error-handling paths: Failures create different behavioral patterns
- Dynamic tool selection: Agent choosing unpredictable tool combinations
- Prompt injection attempts: Malicious users bypassing instructions
- Insufficient training data: Not enough examples to form stable clusters
Action Steps:
- Analyze Outlier Root Causes: Look for common patterns in outlier sessions, identify which features diverge
- Handle Common Patterns: Define standard tool sequences, add timeout guardrails, implement response length limits
- Improve Input Validation: Add request classification, reject out-of-scope requests early, sanitize inputs
- Expand Coverage: Run more sessions to form additional clusters, update prompts for edge cases
- Investigate Security: Review outlier sessions for malicious patterns or prompt injection
Investigating Outliers
- Review Root Cause: Read the specific reason provided by the analysis
- Open Session Details: View the full conversation and execution timeline
- Compare to Normal: Look at typical cluster sessions to see the difference
- Reproduce Issue: Try to recreate the scenario with similar inputs
- Fix or Document: Either fix the issue or document as expected edge case
Not all outliers are problems. Some represent legitimate edge cases:
- Admin operations: Rare maintenance tasks that differ from normal operations
- Error recovery: Graceful handling of tool failures
- Escalations: Correctly identifying when human intervention is needed
- Optimizations: Finding more efficient paths to solutions
Stability & Predictability Scores
Agent Inspector provides quantitative metrics that measure how consistent and predictable your agent's behavior is across sessions. These scores are critical for production readiness assessment.
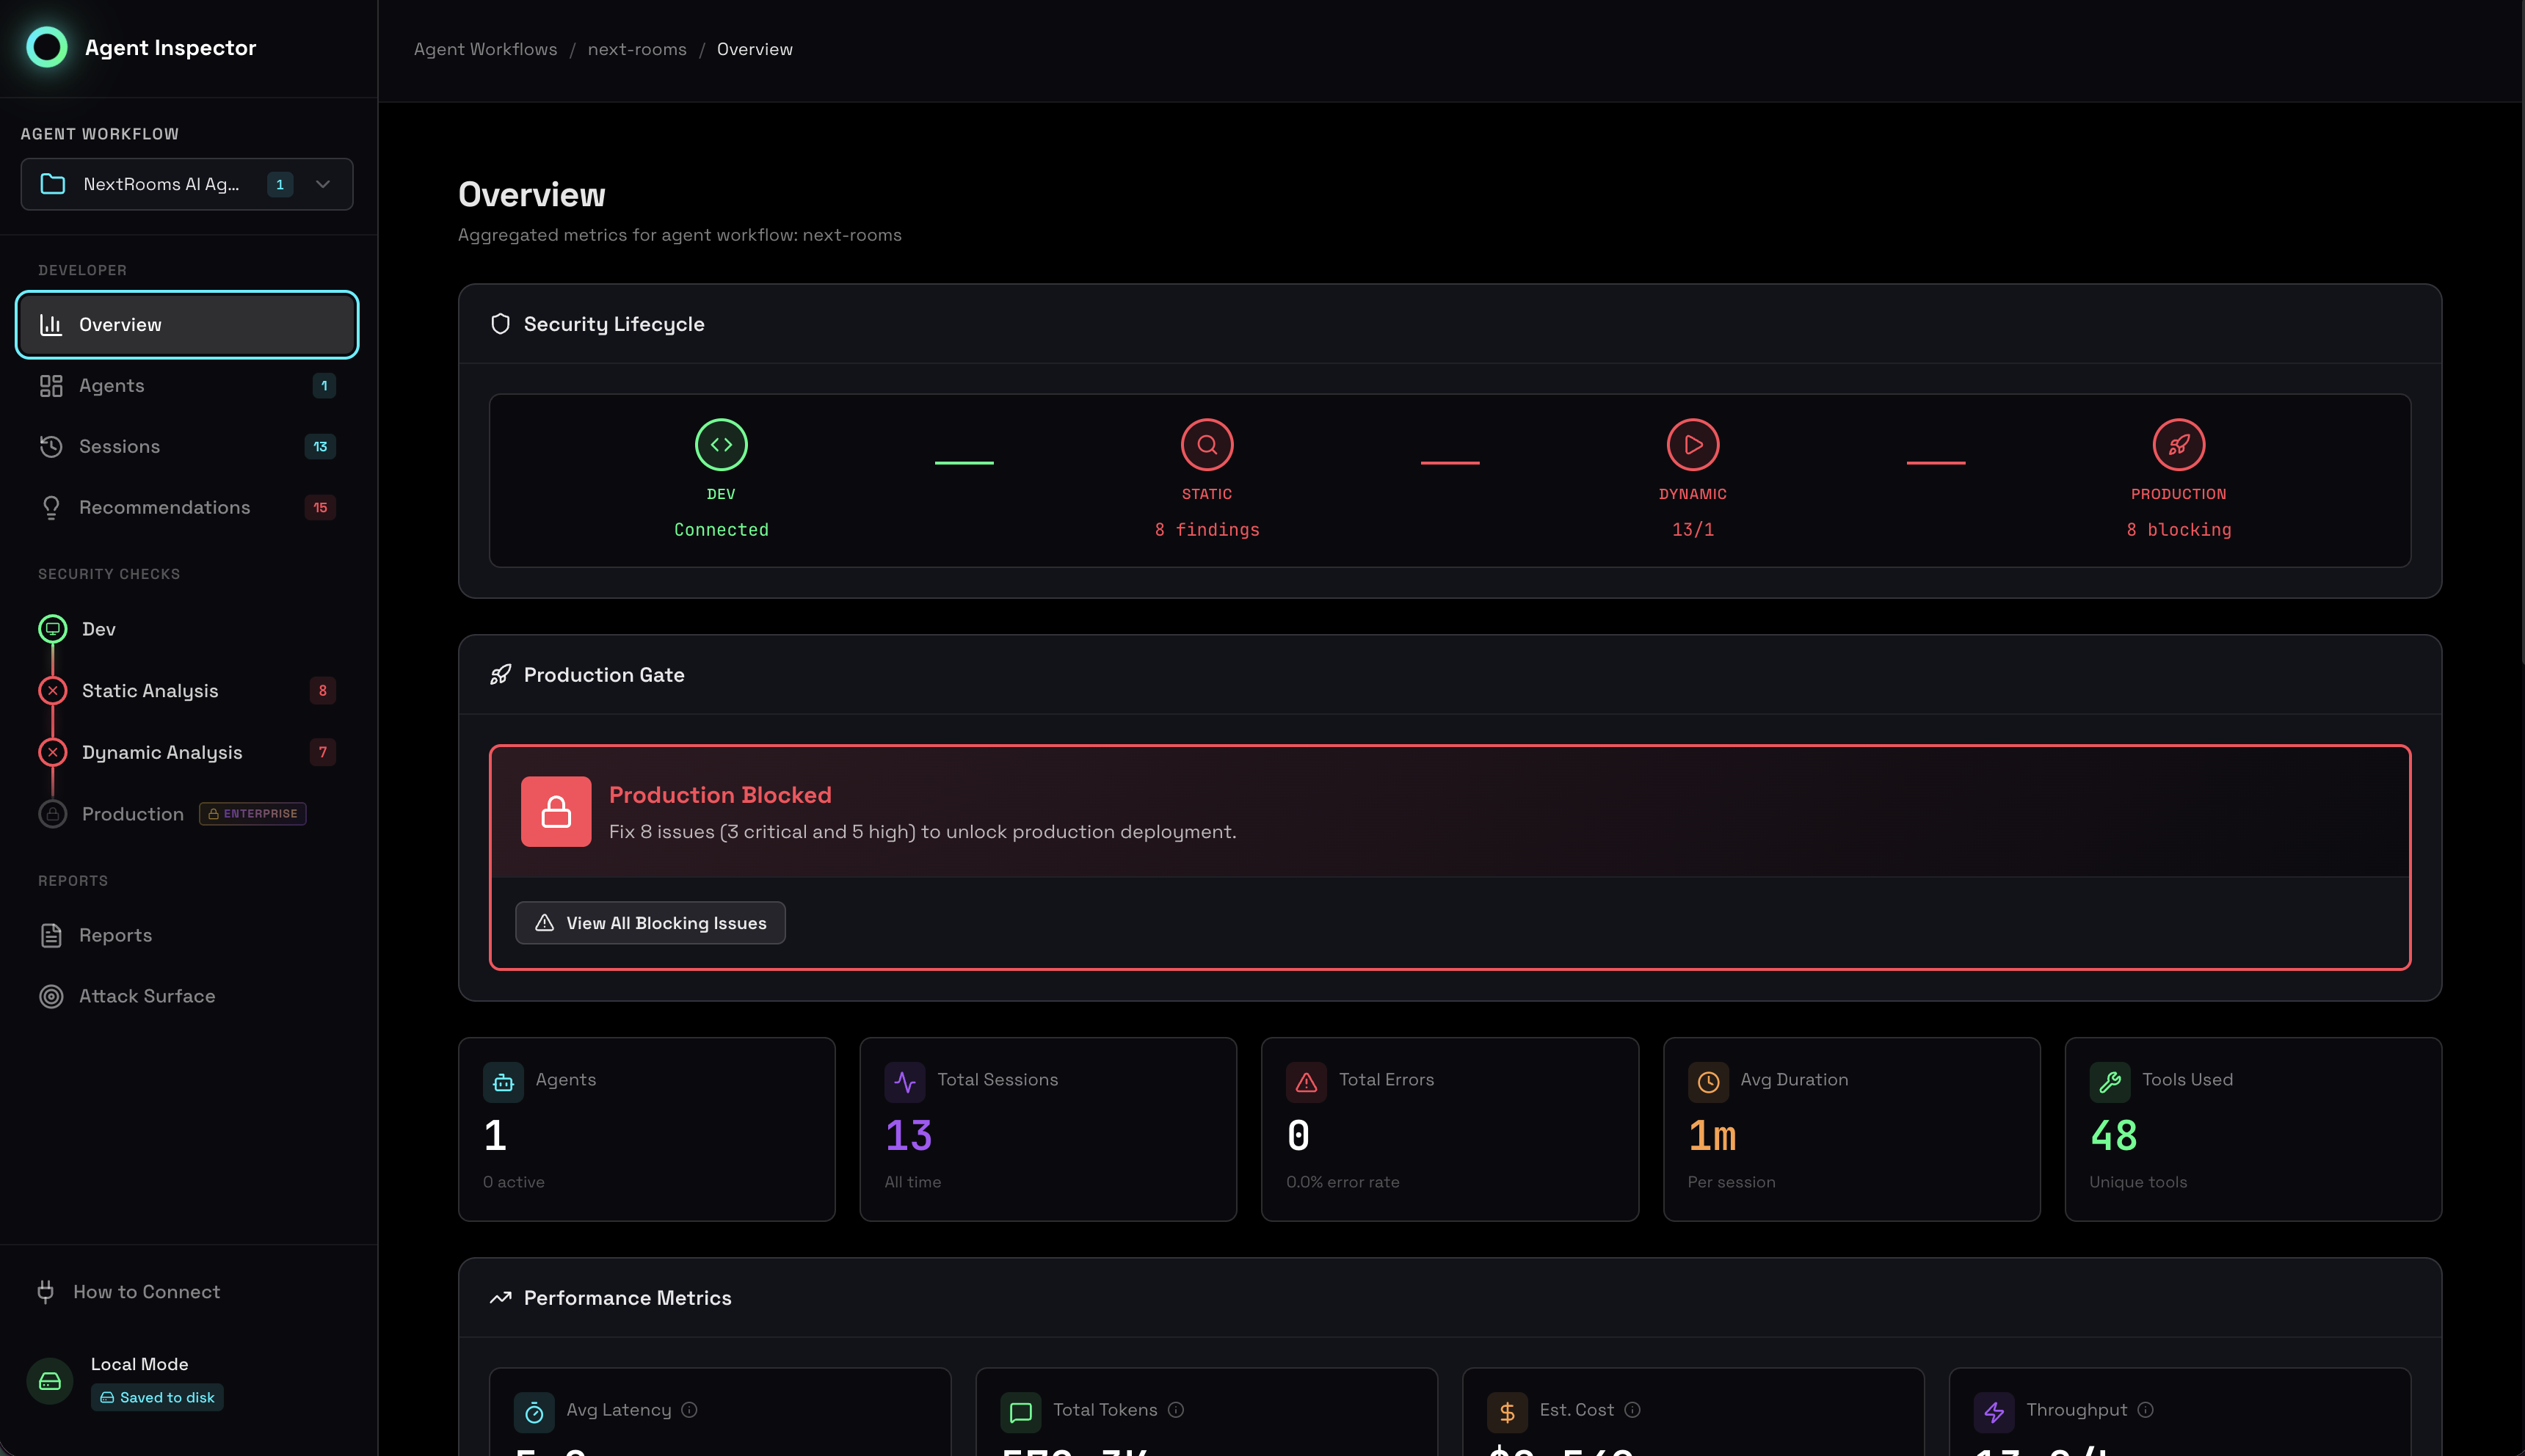
Stability and predictability metrics showing behavioral consistency across sessions
Stability Score
Range: 0-100%
Calculation: (Largest Cluster Size) / (Total Completed Sessions)
Production Gate: Must be ≥80% to pass
Measures how consistently your AI agent behaves across sessions. High stability means most sessions follow the same pattern - critical for production safety. This score represents the percentage of sessions in the dominant behavioral pattern.
Why Stability Matters
- Production Safety: Ensures your agent won't suddenly behave differently in production
- Debugging: Helps identify when agent behavior has changed between versions
- Quality Assurance: Validates that prompts and configurations produce consistent results
- User Experience: Predictable agents create better, more reliable user experiences
| Stability Score | Assessment | Meaning |
|---|---|---|
| 90-100% | Highly Stable | Nearly all sessions follow the same pattern |
| 80-89% | Stable (PASS) | Most sessions are consistent - production ready |
| 60-79% | Moderately Stable | Significant variation exists (CRITICAL - fails gate) |
| <60% | Unstable | High variability, unpredictable (CRITICAL - fails gate) |
When Stability Fails (Score < 80%)
Root Causes:
- Non-deterministic prompts: Prompts allow too much variation in responses
- Context-dependent behavior: Agent adapts too much to different inputs
- Tool usage inconsistency: Agent uses different tools for similar tasks
- Temperature too high: LLM settings allow excessive randomness
Action Steps:
- Review System Prompt: Add explicit instructions for consistent behavior, define clear decision boundaries
- Add Guardrails: Implement validation checks before agent actions, define allowable tool sequences
- Adjust LLM Parameters: Lower temperature (try 0.3-0.5), use deterministic sampling
- Analyze Outlier Sessions: Check sessions outside main cluster to identify triggers
Predictability Score
Range: 0-100%
Calculation: 1.0 - Outlier Rate
Threshold: ≥60% to pass (WARNING if below)
An estimate of the likelihood that future sessions will behave "normally" (not become outliers). High predictability means new sessions will likely fit existing patterns. If outlier rate is 15%, there's an 85% chance a new session will follow known patterns.
Why Predictability Matters
- Capacity Planning: Estimate resource needs for future sessions
- SLA Confidence: Understand likelihood of meeting performance targets
- Risk Assessment: Quantify uncertainty in agent deployments
- Monitoring: Set realistic alert thresholds
Interpretation
- 90-100%: Highly predictable - new sessions almost always fit patterns
- 70-89%: Moderately predictable - most new sessions will be consistent
- 60-69%: Somewhat predictable - noticeable variation expected (PASSES)
- <60%: Unpredictable - cannot reliably predict behavior (WARNING)
Business Impact:
- Low Predictability: Higher customer support costs due to unpredictable UX
- High Predictability: Lower operational risk, easier debugging, more reliable SLAs
Additional Behavioral Metrics
Uncertainty Level
Calculation: 1.0 - Stability Score
Threshold: ≤25% to PASS, >25% WARNING
The inverse of stability score, representing the portion of behavioral variance that remains unexplained by the dominant pattern. High uncertainty means significant unpredictable variation exists.
- 0-10%: Very low uncertainty - high confidence in predictions
- 11-20%: Low uncertainty - good confidence
- 21-25%: Moderate uncertainty - acceptable (PASSES)
- >25%: High uncertainty - significant unknown variance (WARNING)
Why it matters: Explicitly measures what we don't know. Higher uncertainty = higher risk in production, suggesting need for stricter guardrails and controls.
Cluster Formation
Threshold: ≥1 cluster to PASS, 0 clusters CRITICAL
Verification that at least one behavioral cluster successfully formed. Zero clusters means sessions are too diverse to group together, indicating chaotic behavior.
- 0 clusters: No patterns - chaotic, no consistency detected (CRITICAL)
- 1 cluster: Single pattern - uniform behavior across all sessions (ideal)
- 2-3 clusters: Multiple modes - agent has 2-3 distinct operating patterns
- 4+ clusters: High diversity - many behavioral modes (may be too variable)
Critical note: If you have 10+ sessions and 0 clusters form, this indicates a fundamental problem with your agent's design. Do not deploy to production until resolved.
Confidence Levels
The system calculates an overall confidence level based on cluster maturity, data volume, and outlier rate. This indicates how trustworthy the behavioral analysis is.
High Confidence 🟢
Requirements:
- Substantial data volume (≥30 sessions in single cluster, or ≥80 for 2 clusters, or ≥150 for 3+)
- Low outlier rate (≤5% with 200+ sessions)
- Mature, well-established clusters
Interpretation: Behavioral patterns are well-established and reliable. Metrics can be trusted for production decisions.
Use Cases:
- ✅ Safe to deploy agent updates
- ✅ Accurate capacity planning
- ✅ Reliable SLA commitments
- ✅ Trustworthy security posture
Medium Confidence 🟡
Requirements:
- Patterns emerging but need more data (≥15 sessions in single cluster, or ≥40 for 2 clusters, or ≥75 for 3+)
- Moderate outlier rate (6-10% with 200+ sessions)
- Growing clusters
Interpretation: Patterns are visible but not fully stabilized. Metrics provide directional guidance but shouldn't be over-interpreted.
Use Cases:
- ⚠️ Deploy with extra monitoring
- ⚠️ Use conservative resource estimates
- ⚠️ Set loose SLA targets
Low Confidence 🔴
Conditions:
- Insufficient data (<15 sessions)
- High outlier rate (>10% with 200+ sessions)
- Very small or unstable clusters
Interpretation: Not enough data to draw reliable conclusions, or behavior is genuinely unpredictable. Metrics should be considered preliminary.
Action Required:
- 🛑 Do not make production decisions yet
- 🛑 Gather more data before trusting metrics
- 🛑 Investigate high outlier rate causes
- 🛑 Consider redesigning agent if persistent
The system only evaluates outlier rate for confidence calculations once at least 200 sessions have been processed. Below this threshold, outlier rates are too noisy to be meaningful for statistical significance.
Why Behavioral Analysis Matters
Catch Production Issues Early
An agent that passes unit tests but exhibits unpredictable behavior will cause issues in production. Behavioral analysis identifies these problems during development when they're cheap to fix.
Validate Prompt Changes
When you modify prompts or tools, behavioral analysis shows whether you've improved consistency or introduced new unpredictable patterns. Compare before/after stability scores to measure impact.
Enable Confident Deployment
Security teams need quantitative evidence that an agent is production-ready. Behavioral stability scores provide that evidence with objective, measurable criteria.
Understand Operational Complexity
Multiple behavioral modes aren't always bad, but you need to know they exist. Clustering reveals whether your agent is simple (1 mode), multi-modal by design (2-3 modes), or chaotic (≥4 modes).
Best Practices
Run Sufficient Sessions
Behavioral analysis requires statistical significance. Minimum 20 sessions for basic clustering, but different confidence levels require different amounts of data:
- 20 sessions: Minimum for basic analysis
- 30-50 sessions: Ideal for reliable analysis with medium confidence
- 100+ sessions: Best for complex agents, provides high confidence
- 200+ sessions: Required for meaningful outlier rate evaluation
Use Diverse Test Inputs
Test with varied scenarios to capture the full range of agent behavior:
- Different user personas and intents
- Simple and complex queries
- Edge cases and error conditions
- Various input formats and styles
- Both typical and unusual scenarios
Baseline Before Changes
Establish a behavioral baseline before making changes to prompts or tools. This lets you objectively measure whether changes improved or degraded consistency.
Document Expected Modes
If your agent intentionally has multiple operational modes, document each one:
- What triggers each mode
- Expected behavior in each mode
- Acceptable range for cluster distribution
- Known edge cases and outliers
Track Trends Over Time
Run behavioral analysis regularly (e.g., with each PR or deployment) to catch regressions early. Monitor:
- Stability score trending up or down
- Outlier rate changes after modifications
- New clusters appearing unexpectedly
- Cluster size distribution shifts
Integration with Production Gates
Behavioral stability is one of the five production readiness gates. Your agent must achieve a stability score ≥80% to pass. This ensures only agents with proven consistency reach production.
The gate checks:
- Stability score meets threshold (≥80%)
- Outlier rate is acceptable (<20%)
- At least one cluster has formed (≥1)
- Behavioral patterns are documented and understood
Learn more about how behavioral stability integrates with other gates in the Risk Assessment documentation.